


















Lesson 2 of 54 · Getting Started
Weather and climate: two ways to look at the same air
Learn the difference between weather and climate, how a 30-year climate normal is built, what an anomaly is, and why short spells never settle a long-term question.
People say "the weather is changing" when they mean the next hour and "the climate is changing" when they mean the next century. The words sound alike, but they describe different things, and mixing them up is behind many arguments that go nowhere. This lesson pins down what each word means, shows how climate is calculated from weather, and gives you the tools, averages and anomalies, to talk about both honestly.
What you will learn
- The difference between weather and climate, and how each is measured
- How a climate normal is calculated, and why 30 years is the standard period
- What an anomaly is and how to compute one
- Why natural variability hides trends over short periods, and how averaging reveals them
Key terms
- Weather is the condition of the atmosphere at a particular place and time, including temperature, humidity, wind, cloud and precipitation.
- Climate is the statistical description of weather over a long period: averages, spreads and extremes.
- Climate normal is an average over a standard 30-year period, used as a reference. The World Meteorological Organization (WMO) uses 30-year periods such as 1991 to 2020.
- Anomaly is the difference between a value and the normal for that time of year: anomaly = value − normal.
- Variability is the natural scatter of values from one day, month or year to the next.
Weather: the state of the air right now
Weather is what you see out of the window. It is described by a handful of variables: air temperature, humidity, pressure, wind speed and direction, cloud cover and type, visibility, and any precipitation. Weather changes on time scales from minutes (a gust, a shower) to days (a front passing). Because the atmosphere is chaotic, the exact state of the air becomes unpredictable beyond roughly one to two weeks. This limit was recognized in the 1960s by the American meteorologist Edward Lorenz, who found that tiny changes in the starting numbers of a simple model grew until they changed the whole result. Forecasts are therefore about weather in the next days.
Climate: what weather does on average
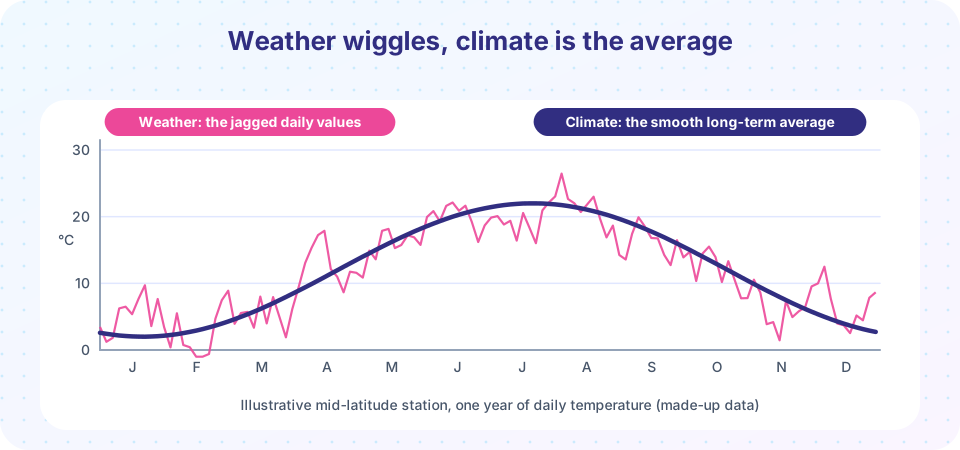
Climate is not the weather on a specific day. It is the pattern behind the days. A statement such as "Cairo is dry and hot in summer" or "Seattle has a wet winter" describes climate. Climate includes the average, but also the spread (how much temperature varies from year to year) and the extremes (the hottest day in 100 years, the wettest month on record).
The standard way to measure climate is to take a long record and compute statistics. The WMO recommends 30-year periods, because that is long enough to smooth out most year-to-year noise from natural phenomena such as El Niño, yet short enough to follow real change. The current standard normal period is 1991 to 2020. A "normal" in this sense does not mean "expected on a typical day". It is simply the average of the recent past, and the true weather is expected to scatter around it.
The ideas "climate is what you expect, weather is what you get" and "climate is your wardrobe, weather is what you wear today" are both common shortcuts. They are fine as long as you remember that climate also includes the range of what to expect, not only the middle.
Time scales
| Time scale | Name | Example |
|---|---|---|
| Minutes to hours | Weather (nowcasting) | A thunderstorm crossing town |
| Days to about two weeks | Weather (forecasting) | A cold front arriving on Thursday |
| Months to years | Climate variability | A wet season, an El Niño winter |
| Decades to centuries | Climate and climate change | Long-term warming of the global average |
The same instruments and physics apply across all of these scales. What changes is the question you ask and the averaging you use.
Building a climate normal
Suppose you want the climate normal for July temperature at one station. You gather the July mean temperature for each year from 1991 to 2020 (30 values) and take their average. That average is the normal, written for example as 21.0 °C. You can also compute the standard deviation of the 30 values, which measures the typical spread. If the standard deviation is 1.2 °C, then a July that is 1 °C warmer or cooler than the normal is entirely ordinary, while one that is 3 °C warmer is rare.
An anomaly then tells you how unusual a value is: if July of a particular year averaged 22.5 °C, its anomaly is 22.5 − 21.0 = +1.5 °C. Anomalies are the language of climate monitoring because they remove the seasonal cycle. A +1.5 °C anomaly means the same thing whether it occurs in a hot July or a cold January, so anomalies from many places can be compared and averaged.
Variability versus trend
Now the important question. Imagine that the true climate slowly warms by 0.3 °C per decade, but each year's temperature also scatters by about 0.5 °C from natural causes. In any single year, that scatter can be larger than the change in a decade, so one cold year can easily happen in a warming climate. The trend only shows when you average over many years or plot many years together. This is why scientists look at 30-year means or long trend lines rather than single years.
This also explains the common confusion about cold snaps. A winter cold spell is a weather event. It is a real observation, but it tells you almost nothing about whether the 30-year average has shifted. A claim about climate needs climate-length evidence, and a claim about tomorrow needs weather-length evidence.
Press Run (or Ctrl + Enter) to see the result here.
Program input · what you'd type while the program runs
Type the answers before you press Run, one per line. Each time the program reads a line (with input()), it gets the next line from this box.
Why averaging reveals trends
The second experiment builds 60 years of annual mean temperatures that contain a slow warming trend plus random scatter. It then compares what you would conclude from a handful of single years with what the 30-year means say.
Press Run (or Ctrl + Enter) to see the result here.
Program input · what you'd type while the program runs
Type the answers before you press Run, one per line. Each time the program reads a line (with input()), it gets the next line from this box.
Common misconceptions
"A cold winter disproves climate change." One cold winter is weather. Climate is judged from decades of data, and natural variability is large over a few years.
"The climate normal is what should happen." The normal is just the past average. Real weather varies around it, and the normal period is updated every ten years or so as new data arrive.
"Weather forecasts and climate projections are the same job." A weather forecast starts from today's observed state and predicts a specific day. A climate projection does not predict a specific day, it estimates the statistics of weather under given conditions, such as greenhouse gas levels.
Check your understanding
Quick check · 5 questions
of 5 answered You scored / 5 · perfect!
-
1. Which statement is about climate rather than weather?
A description of what summers are usually like is a statistical statement about many years, which is climate. The others describe specific times. -
2. What is the standard averaging period for a WMO climate normal?
30 years is long enough to smooth out most year-to-year noise but short enough to reflect current conditions. -
3. A station's July normal is 21.0 °C and one July averaged 18.4 °C. What is the anomaly?
Anomaly = value minus normal = 18.4 - 21.0 = -2.6 °C, so that July was cooler than normal. -
4. Why can a single cold year occur even if the climate is slowly warming?
A slow trend is a small change per year compared with natural scatter, so individual years can fall on either side of the trend. -
5. Why can forecasts not be extended indefinitely?
Lorenz showed that small differences in initial conditions grow, which limits deterministic weather forecasts to roughly one to two weeks.
Summary
- Weather is the state of the atmosphere at a given time and place. Climate is its long-term statistics.
- A climate normal averages a variable over a standard 30-year period.
- An anomaly equals value minus normal and removes the seasonal cycle, so unlike places and seasons can be compared.
- Natural variability can hide small trends over short spans; averaging over many years reveals them.
- Weather forecasts predict specific days, while climate projections estimate statistics.
Next: Observing the weather
Track your progress
Create a free account to tick off lessons and pick up where you left off on any device.
of Meteorology lessons completed