


















Lesson 45 of 54 · Severe Weather and Climate Links
Weather and climate change
Learn the difference between weather and climate, why a warmer atmosphere changes heat, rain and storms, and how attribution science links single events to warming.
Every time an extreme event hits the news, someone asks: was this climate change? It is an understandable question, and it is hard to answer in a sentence. Weather events have always happened. A heat wave, a flood or a hurricane is an event with a long list of causes, and the climate is only one of them. But the climate does determine how often events of a given strength occur, so it changes the odds. In this lesson you will separate weather from climate, learn the physics that connects a warmer world to more intense heat and rain, see what the evidence says about different kinds of storms, and meet the scientific method, called attribution, that tries to answer the question about a particular event. Climate science itself has its own full course on this site, climate science, and this lesson only draws the connections to the weather you have learned so far.
What you will learn
- Distinguish weather from climate and define a climate normal.
- Explain why heavy rain increases about 6 to 7 percent per degree of warming.
- Show with a simple model how a shifted average changes extremes.
- Summarize what is known about hurricanes, tornadoes, droughts and cold spells.
Key terms
Climate is the statistics of weather over a long period, usually 30 years. Climate normal is the 30-year average of a variable. Clausius–Clapeyron relation is the rate at which saturation vapor pressure rises with temperature. Attribution is the scientific study of how much a cause, such as warming, changed the likelihood or intensity of an event. Compound event is a combination of hazards that occur together.
Weather versus climate
Weather is the state of the atmosphere at a time and place: this afternoon's thunderstorm, this week's cold spell. Climate is the statistics of weather over a long time: the average, the range and the frequency of extremes. The World Meteorological Organization uses 30 years as the standard averaging period, and the 30-year average is called a climate normal. A popular saying summarizes it: climate is what you expect, weather is what you get.
This is why a single cold winter day says nothing about global warming, and why a single hot day does not prove it either. A trend is judged from decades of data across the whole globe. Global average surface temperature in the decade 2011–2020 was about 1.1 °C above the 1850–1900 average, according to the Intergovernmental Panel on Climate Change (IPCC). A 1.1 °C rise sounds small, but the difference between today and the last ice age was only about 5 to 6 °C. Because the average moves slowly but weather varies enormously from day to day, the signal appears first in statistics, such as the number of record highs compared with record lows, before it is clear in any given week.
Heavier rain: Clausius–Clapeyron
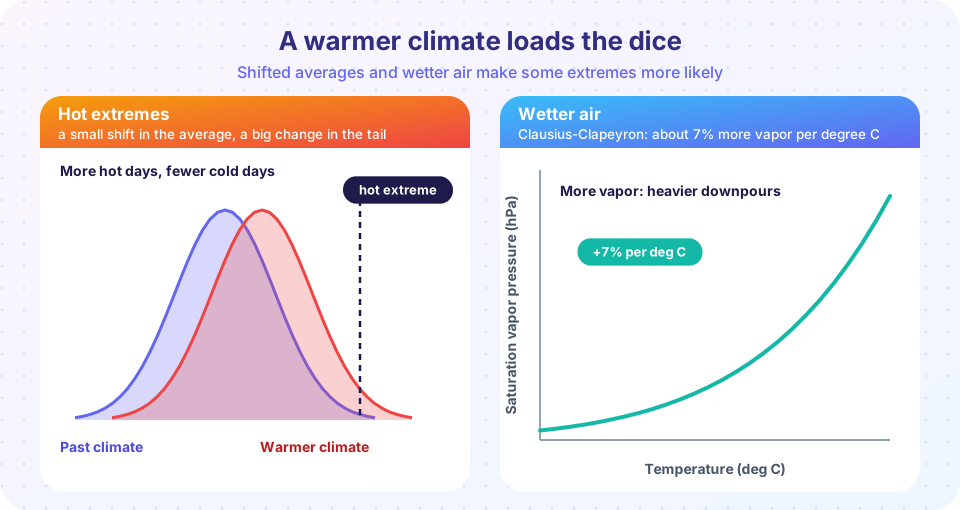
One of the best-understood links is between temperature and water. Warmer air can hold more water vapor before it becomes saturated. The relation, due to Clausius and Clapeyron, gives about a 6 to 7 percent increase in saturation vapor pressure per degree Celsius at typical temperatures near the ground. If the relative humidity stays roughly the same, as it tends to over the oceans, then a warmer atmosphere contains about 6 to 7 percent more water vapor per degree. Heavy rain events draw on all the moisture converging into a storm, so their intensity tends to increase at a similar rate. Observations show that heavy precipitation events have become more intense in most regions of the world with good data, which is consistent with this physical expectation.
The total rainfall of a year does not have to rise at the same rate; in fact, rain may become more concentrated, with heavier downpours and longer dry spells between them. Warmer air also dries out soils faster, so drought and flood risk can both increase in the same place.
Press Run (or Ctrl + Enter) to see the result here.
Program input · what you'd type while the program runs
Type the answers before you press Run, one per line. Each time the program reads a line (with input()), it gets the next line from this box.
Heat: shifting the whole distribution
Daily temperatures at a place follow roughly a bell-shaped distribution around the seasonal average. Shift the whole distribution up by a degree and you do not just make every day a little warmer: you push a bigger share of the curve beyond any fixed hot threshold. Because the extremes sit in the thin tail of the curve, their frequency changes proportionally much more than the mean. The effect is strongest for rare events and for events defined by a fixed absolute threshold, such as a temperature that is dangerous for human health.
The calculator below shows it with the normal distribution. Suppose a summer temperature has a standard deviation of 3 °C, and consider the threshold that the old climate exceeded only about 2.3 percent of the time (two standard deviations above the mean). Move the slider to see what a shift in the mean does to the frequency of exceeding that fixed threshold.
What the evidence says about storms
Different hazards have different levels of confidence. The following summary reflects the assessments of the IPCC and similar reviews, expressed in plain language, and it will change as the science progresses.
- Heat extremes. Hot extremes have become more frequent and more intense across most land regions since the 1950s, and cold extremes less frequent. Confidence is very high.
- Heavy rain. Heavy precipitation has intensified in most regions with data, consistent with the physics above.
- Drought. Warming raises evaporation and can worsen agricultural and ecological drought in some regions, though the pattern depends on rainfall changes too.
- Tropical cyclones. Models and observations suggest that the proportion of storms reaching major hurricane strength is increasing, that rain rates are higher, and that storms are intensifying faster. Rising sea level adds to storm surge. The total number of storms globally has not clearly changed, and there is more uncertainty about regional changes in frequency.
- Tornadoes and severe thunderstorms. Tornadoes are small, and their records are affected by changes in reporting and population, so trends are hard to detect. Projections suggest that the environments favorable for severe thunderstorms (more CAPE) will increase in some regions, while shear may decrease, so the net effect is uncertain.
- Winter storms and cold spells. Fewer cold extremes overall, but cold air outbreaks still happen. How Arctic warming affects the jet stream is an active research topic, and scientists disagree on its strength.
- Sea level. Global mean sea level has risen about 20 cm since 1901, so the same storm surge reaches farther inland.
Many damaging events are compound events: for example, a hurricane surge together with heavy rain from the same storm, or a heat wave on top of drought. Impacts depend as much on exposure and vulnerability (where people live and how prepared they are) as on the physical hazard.
Attribution: was this event caused by climate change?
Event attribution asks a precise question: how did climate change alter the probability or intensity of this kind of event? Scientists run climate models or analyze observations twice, once for the world as it is and once for a counterfactual world without human-caused warming. They compare the probability of the event in each: P1 for today and P0 for the world without warming. Two numbers summarize the result:
- Probability ratio:
PR = P1 / P0 - Fraction of attributable risk:
FAR = 1 − P0/P1
If an event had a 1 percent annual chance in the cooler world and now has a 3 percent chance, then PR = 3 and FAR = 0.67. That is, about two-thirds of the current risk is attributable to warming. Attribution studies, such as the rapid analyses done by the World Weather Attribution group, find strong links for heat waves, clear but more variable links for heavy rain, and weaker or uncertain ones for some kinds of storm. An attribution statement is a statement about odds. It does not say that the event "would not have happened" without climate change, and it does not blame climate change for every detail of the event.
Common misconceptions
"A cold winter disproves global warming." Weather varies; climate is the long-term statistics, and warming raises the average while cold snaps still occur. "Climate change causes every disaster." Events have many causes, and attribution quantifies only the part of the risk changed by warming. "If the average rises 1 degree, every day is 1 degree warmer." The distribution shifts and changes shape, so extremes change disproportionately. "Scientists cannot say anything about single events." They cannot say what caused one event, but they can say how much more likely or intense it became.
Check your understanding
Quick check · 5 questions
of 5 answered You scored / 5 · perfect!
-
1. Climate is best defined as
Climate describes the average, variability and extremes of weather over decades. -
2. Warmer air holds about how much more water vapor per degree Celsius?
The Clausius-Clapeyron relation gives roughly 6 to 7 percent more saturation vapor pressure per degree. -
3. Why does a small shift in average temperature change extremes so much?
A shifted bell curve puts a much larger share beyond a fixed hot threshold. -
4. If P0 = 1% and P1 = 4% per year, the probability ratio is
PR = P1 / P0 = 4 / 1 = 4, so the event is four times as likely. -
5. Which statement about tornadoes and climate change is the most accurate?
Reporting changes and small scale make trends difficult, and CAPE and shear may change in opposite ways.
Summary
- Weather is the event; climate is the statistics. Trends are judged over decades and the globe.
- Warmer air holds about 6 to 7 percent more water vapor per degree, so heavy rain gets heavier.
- A shifted temperature distribution makes hot extremes disproportionately more frequent.
- Confidence is highest for heat and heavy rain, lower for tornadoes, and intermediate for hurricanes.
- Attribution compares the world with and without warming, giving a probability ratio and a fraction of attributable risk.
Track your progress
Create a free account to tick off lessons and pick up where you left off on any device.
of Meteorology lessons completed