


















Lesson 48 of 54 · Projects and Practice
Project: analyzing a weather station record
Analyze 72 hours of synthetic station data with Python: plot a meteogram, compute humidity and pressure tendency, find a cold front and test how strong a front must be to detect.
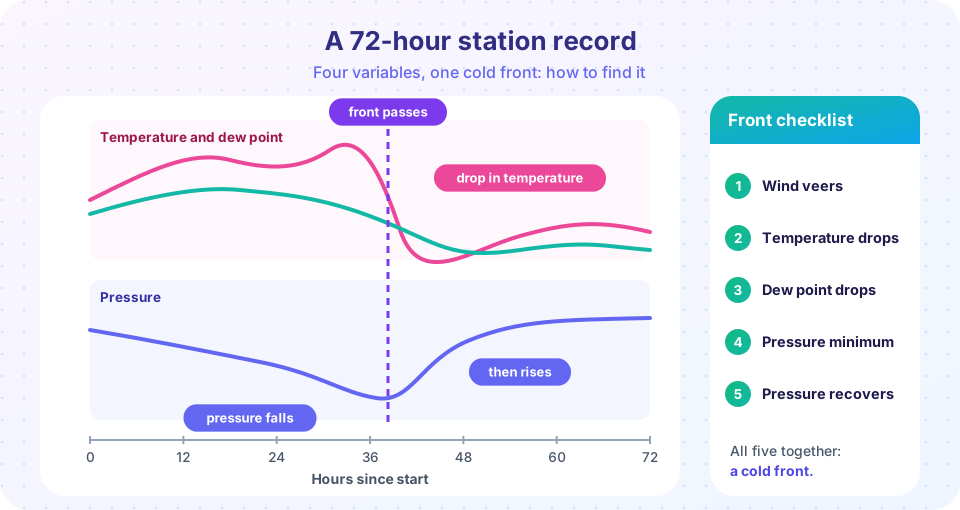
A weather station writes down the same few numbers every hour: temperature, dew point, pressure, wind direction and speed. Taken alone, each number is dull. Together, over three days, they tell a story: a warm humid spell, a pressure fall, a sudden wind shift, a drop in temperature and humidity, and a recovery of pressure. That story is a cold front passing the station. In this project you will build that record yourself, write code that finds the front in the data, derive extra quantities from the raw variables, and then test how strong a front has to be before your detector misses it. The record is synthetic, generated by a program with a fixed random seed, so that you know the true answer and can judge your analysis.
What you will learn
- Read and plot a multi-variable station record as a meteogram.
- Derive relative humidity, pressure tendency and wind components from raw data.
- Detect a front with simple rules, and understand how the rules can fail.
- Describe the result in physical words.
Key terms
Meteogram is a time series plot of several weather variables at one place. Pressure tendency is the change of pressure over the last three hours. Veering is a clockwise change of wind direction. Relative humidity (RH) is the ratio of actual to saturation vapor pressure. Magnus formula is an approximation of saturation vapor pressure used to compute RH from temperature and dew point.
Step 1: build and plot the record
The first block creates a 72-hour record with a cold front passing at hour 40. The temperature has a daily cycle (warmest mid-afternoon) plus a fast drop at the front. The dew point drops more slowly. Pressure falls steadily as the front approaches and rises after it passes. The wind veers from southwest to northwest and gusts at the front. Small random noise makes it look like real measurements.
Press Run (or Ctrl + Enter) to see the result here.
Program input · what you'd type while the program runs
Type the answers before you press Run, one per line. Each time the program reads a line (with input()), it gets the next line from this box.
Before you read on, look at the plot. The front should stand out in every panel at about the same time. Which panel shows it most clearly? Usually the wind direction, because the veer is a near-instant step, while temperature and pressure also carry the daily cycle and slow trends.
Step 2: derived quantities
Raw variables are only the beginning. Three derived quantities help in practice.
Relative humidity comes from the temperature and dew point with the Magnus formula:
RH = 100 · exp(17.625 Td / (243.04 + Td)) / exp(17.625 T / (243.04 + T))
with both temperatures in °C. When the dew point equals the temperature, the air is saturated and RH is 100 percent.
Pressure tendency is the change of pressure over the previous 3 hours, p(t) − p(t − 3). Forecasters pay close attention to it: a steady fall of 3 hPa in three hours or more means an approaching low or front, and a quick rise after a minimum shows that the front has passed.
Wind components turn direction (where the wind comes from) and speed into the eastward component u and northward component v: u = −speed · sin(direction), v = −speed · cos(direction). Components can be averaged and subtracted, which direction angles cannot.
Press Run (or Ctrl + Enter) to see the result here.
Program input · what you'd type while the program runs
Type the answers before you press Run, one per line. Each time the program reads a line (with input()), it gets the next line from this box.
Run it and compare the numbers with what you expect. Relative humidity before the front, with the dew point a few degrees below the temperature, is well below saturation, and the post-frontal value depends on how quickly the dew point fell compared with the temperature. Notice that cold air behind the front is not necessarily drier in relative terms, even though its dew point, and therefore its actual vapor content, is lower. That is a good reminder of why meteorologists prefer the dew point to relative humidity when tracking air masses.
Step 3: detect the front, then break the detector
A human forecaster recognizes a front by several signs at once. A simple automatic detector can do the same by looking for a large temperature drop over three hours together with a clockwise wind shift of at least 45 degrees. The function below scans the record. Then you will lower the strength of the front, the drop parameter, to see where detection fails.
Press Run (or Ctrl + Enter) to see the result here.
Program input · what you'd type while the program runs
Type the answers before you press Run, one per line. Each time the program reads a line (with input()), it gets the next line from this box.
You should see that the detector finds strong fronts at about the right hour, and that it starts to miss weak ones. The reason is that the wind veer in this synthetic record is built in at the same size for every front, but the temperature drop that the detector requires shrinks with the front's strength. In real data it is worse: diurnal heating can hide a weak temperature drop or mimic a false one in the late afternoon, and a front passing at night is easier to see than one passing at noon. This is why forecasters use several clues and a surface map, not a single rule.
Extensions to try
- Change
frontto 18 or 60 and check that the detector follows it. What changes when the front passes in the early morning when the daily cycle is cooling the air as well? - Add noise: raise the temperature noise from 0.25 to 1.0 and see how often the detector produces a false front in a record that contains no front (set
drop=0). - Add a warm front by making the temperature rise by 5 °C over 12 hours while the wind veers from southeast to south and pressure falls steadily. Which of the five signs of the cold front are absent?
- Compute the heat index at the warmest hour before the front using the formula in the floods and heat lesson, if the temperature is above 27 °C and the relative humidity is above 40 percent.
Common misconceptions
"A temperature drop always means a cold front." A thunderstorm outflow, a sea breeze or evening cooling can also cool the air. The wind shift, the dew point and the pressure confirm it. "Lower relative humidity means lower moisture." Relative humidity depends on temperature; the dew point is the better measure of how much vapor the air holds. "Averaging wind directions is fine." An average of 350 and 10 degrees is 180 if you add the numbers, but the real wind is almost northerly; use components.
Check your understanding
Quick check · 5 questions
of 5 answered You scored / 5 · perfect!
-
1. Which set of signs best indicates a cold front passage?
These are the five signs of a cold front: veer, temperature drop, dew point drop, pressure minimum, then recovery. -
2. A wind of 270 degrees means the wind blows from the
Wind direction gives the direction the wind comes from, so 270 degrees is from the west. -
3. Why use the dew point to track air masses instead of relative humidity?
Relative humidity depends on both vapor content and temperature, whereas the dew point reflects the vapor content. -
4. A 3-hour pressure change of -3.5 hPa suggests
A rapid fall indicates that a low-pressure system or front is approaching. -
5. Why average wind components rather than directions?
The mean of 350 and 10 degrees is not 180 degrees; vectors avoid that problem.
Summary
- A meteogram shows several variables at once; a front appears as a coordinated change in all of them.
- Derived variables such as RH, pressure tendency and wind components make analysis easier.
- A rule-based detector finds strong fronts and misses weak ones; combine several clues.
- Always interpret results physically, and use dew point, not RH, to follow air masses.
Track your progress
Create a free account to tick off lessons and pick up where you left off on any device.
of Meteorology lessons completed