


















Lesson 47 of 54 · Projects and Practice
Chapter overview: Projects and practice
Preview the final chapter of the meteorology course: three hands-on projects, a practice problem set, a glossary, a cheat sheet and suggestions for further study.
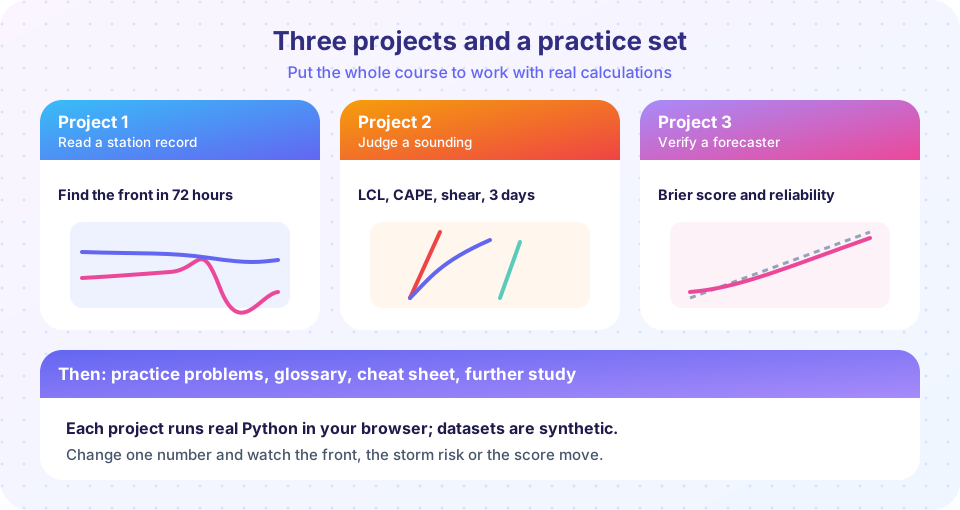
Knowing the ideas of meteorology and being able to use them are two different skills. You have met pressure, fronts, forecasts and storms one at a time, with a small calculation or demo in each lesson. In this last chapter you combine them. Three projects ask you to behave like a working meteorologist: read a record of observations and find the front hidden in it, judge a sounding to decide whether a storm can grow, and check whether a forecaster's probabilities can be trusted. The chapter finishes with a set of practice problems with worked answers, a glossary, a one-page cheat sheet and a map of where to study next.
The big picture
Real meteorological work follows a loop that you have already seen in the forecast chapter: observe, analyze, decide, check. The three projects follow the same loop at different scales. In the first project you start from raw numbers, the way a station record arrives, and turn them into physical insight: where is the front, how fast did the temperature fall, how strong was the wind shift? In the second you work with a vertical profile instead of a time series, and you compute the quantities that determine whether thunderstorms form. In the third you look at the forecasts themselves and ask how good they were.
The data are all synthetic. They are generated by the code with a fixed random seed so that every run gives the same result, and they are built to resemble the real thing without being a measurement of any real event. That choice is deliberate: it lets you know the right answer in advance, change a parameter, and see exactly what changes. When you work with real observations in the future, you will use the same tools, and the answer will be less tidy.
Project 1: the station record
From raw numbers to physics.
Project 2: the sounding
Project 3: the forecaster
Then consolidate
What each lesson covers
- Project: analyzing a weather station record walks you through the synthetic record, finding a cold front, computing relative humidity and pressure tendency, and plotting a meteogram.
- Project: sounding and storm risk builds three soundings, computes LCL, CAPE and bulk shear, and classifies the storm risk for each day.
- Project: forecast verification study generates two forecasters, one calibrated and one overconfident, and compares their scores and reliability diagrams.
- Practice problems has thirteen numeric problems with worked answers and a code cell that checks them all.
- Glossary lists the key terms of the course with short definitions.
- Cheat sheet gathers the key relations on one page.
- Further study suggests where to go from here.
How to work through a project
- Run the code first. Read each block and predict what it will print before you run it.
- Change one thing at a time. Move the front time, shift the temperature, change the seed. Note what moves and what does not.
- Write down the physical meaning. A number without a sentence about what it means is not yet an analysis.
- Check units and sizes. Pressure near 1000 hPa, temperature in degrees Celsius, wind in meters per second or knots, and a sanity check at every step.
Try it
Use this short checklist to plan a project before you start. It only stores your ticks while the page is open.
Check your understanding
Quick check · 3 questions
of 3 answered You scored / 3 · perfect!
-
1. Why do the projects use synthetic data?
With synthetic data the truth is known, so you can check your analysis and experiment safely. -
2. What is the first thing to do when you open a project?
Predicting first turns the exercise into a test of your understanding. -
3. Which loop do the projects follow?
It is the same loop used in operational forecasting.
Summary
- The final chapter applies the course to three projects, with practice, glossary, cheat sheet and next steps.
- All project data are synthetic, reproducible and labelled.
- Work by predicting, changing one thing at a time, and writing down the physical meaning.
Track your progress
Create a free account to tick off lessons and pick up where you left off on any device.
of Meteorology lessons completed