


















Lesson 35 of 54 · Forecasting
Observing the atmosphere
Learn how the global weather observing system works: surface stations, radiosondes, radar, satellites and aircraft, plus how to decode the station model and radar reflectivity.
Every forecast begins with a question: what is the atmosphere doing right now? Nobody can answer it completely. The atmosphere is a fluid that fills a layer thousands of kilometers wide and tens of kilometers deep, and every instrument we have samples only a tiny part of it. Meteorologists answer the question the way a detective reconstructs a scene: by combining many imperfect clues, each seen from a different angle. In this lesson you will meet the main clues, learn what each one tells you and what it hides, and practice decoding two of the most common formats: the station model and the radar reflectivity image.
What you will learn
- Name the main observing platforms and the variables each measures.
- Describe the three kinds of satellite imagery and the two kinds of orbit.
- Interpret radar reflectivity and Doppler velocity.
- Decode surface pressure codes and wind barbs.
Key terms
Radiosonde is an instrument package carried by a weather balloon. UTC is Coordinated Universal Time, the common clock of meteorology. Reflectivity is the strength of the radar echo from precipitation, in dBZ. Geostationary orbit is a circular orbit 35,786 km above the equator, matching Earth's rotation. Representativeness error is the mismatch between a point measurement and the grid-box average a model needs.
Surface observations
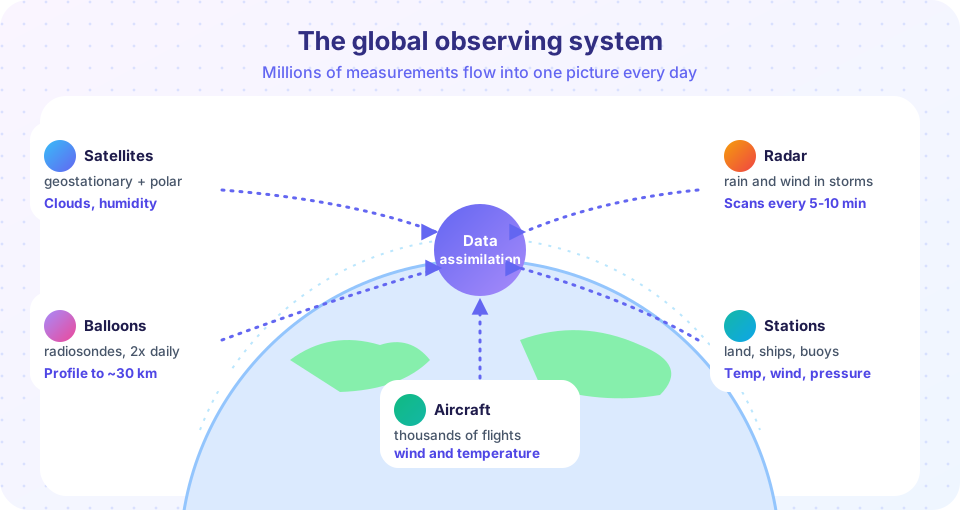
The oldest and densest network consists of surface stations. Thousands of land stations, plus ships and moored and drifting ocean buoys, measure temperature, dew point, pressure, wind, visibility, cloud and weather. Airports report each hour in a coded format called METAR, with special reports when conditions change quickly. Automatic stations report temperature, wind and pressure every few minutes.
All times in meteorology are given in UTC (also called Zulu time), so that observations from every country line up. Observations are taken at fixed times, which are called the synoptic hours, 00, 06, 12 and 18 UTC, and these are also the standard times for forecast model runs.
Reading a station model
On a surface map each station is shown as a small cluster of symbols called the station model. The temperature sits to the upper left and the dew point to the lower left, both in whole degrees. A circle in the middle is shaded to show the fraction of the sky covered by cloud. A line from the circle, the wind staff, points toward the direction the wind comes from, and it carries feathers called barbs showing the speed: a half barb is 5 knots, a full barb 10 knots, and a triangular pennant 50 knots.
Pressure is written to the upper right as three digits in tenths of a hectopascal, with the leading 9 or 10 and the decimal point dropped. So 132 means 1013.2 hPa and 875 means 987.5 hPa. The rule is simple: if the three digits are 500 or higher, put a 9 in front and a decimal point before the last digit; otherwise put 10 in front.
Press Run (or Ctrl + Enter) to see the result here.
Program input · what you'd type while the program runs
Type the answers before you press Run, one per line. Each time the program reads a line (with input()), it gets the next line from this box.
Upper-air observations
The wind and temperature at the surface say little about what is happening a few kilometers up. To see through the layers, meteorologists send up radiosondes: a latex balloon carries a small package with sensors for pressure, temperature and humidity, and a radio transmitter. Position from a GPS receiver gives the wind. The balloon rises at about 5 m/s, and as the air thins it expands until it bursts at around 30 km, an hour and a half later, when the instrument falls back on a parachute. About 800 stations around the world launch a balloon twice a day, at 00 and 12 UTC, so that the world has simultaneous profiles. The plot of temperature and dew point against pressure, called a sounding, is the main tool for judging instability and storm risk.
Aircraft also help: commercial airliners report wind and temperature along their routes and on takeoff and landing, which gives profiles near airports and data over oceans where no balloons fly.
Radar
A weather radar sends out short pulses of microwaves and listens for the echo from raindrops, hailstones and snowflakes. The time delay of the echo gives distance, the direction of the antenna gives bearing, and the strength gives reflectivity, written in dBZ on a logarithmic scale. Light rain is about 20 dBZ, moderate rain about 30 to 40 dBZ, and values of 50 dBZ and higher suggest very heavy rain or hail.
Reflectivity can be converted to a rain rate with an empirical relation. The classic Marshall–Palmer form is Z = 200 R^1.6, where Z is the radar reflectivity factor in mm⁶/m³ (so that dBZ = 10 log₁₀ Z) and R is the rain rate in mm/h. Solving gives R = (Z/200)^(1/1.6). At 40 dBZ, Z = 10,000 and R ≈ 11.5 mm/h. The relation is an approximation, and hail inflates the echo so that the real rain is less than the formula suggests.
Doppler radar also measures the motion of the targets toward or away from the radar, giving the wind within the storm. When a strong inbound velocity sits next to a strong outbound velocity, the pattern shows rotation and can warn of a tornado. The U.S. network has roughly 160 high-power radars; many countries run similar networks. A radar beam travels in a straight line while the Earth curves away, so the beam is higher the farther it goes, and it cannot see low-level weather at long range or behind mountains.
Satellites
Satellites provide the only truly global view. Two orbit types are used.
- Geostationary satellites orbit 35,786 km above the equator at the same angular speed as the Earth, so each one stays over a fixed spot and watches one hemisphere continuously, with a new image every 10 to 15 minutes or faster. They are ideal for following storms but see the poles poorly.
- Polar-orbiting satellites circle the Earth from pole to pole at about 800 to 850 km, making roughly 14 orbits per day. Because Earth rotates beneath them, each point on the globe is covered at least twice a day. Their lower altitude gives sharper detail and allows microwave sounders that see through clouds to measure temperature and humidity at many levels.
Three kinds of imagery are in everyday use. Visible images show reflected sunlight: bright for thick cloud, dark for ocean, available only in daylight. Infrared images show heat radiated by the surface and clouds. Because temperature falls with height, cold (bright, in the usual display) cloud tops are high, and a very cold top often marks a storm. Infrared works day and night. Water vapor images show the moisture in the middle and upper troposphere, including dry slots and jet-stream patterns that are invisible without cloud.
Other sensors broaden the view: scatterometers measure ocean winds from the roughness of the sea, GPS radio occultation measures temperature and humidity by how a signal bends through the atmosphere, lightning mappers record flashes, and thousands of drifting ocean floats measure the sea beneath the weather.
From observations to the model
Observations are noisy, unevenly spread and measure different things at different times. A model, on the other hand, needs a value at every grid point in a consistent state. The step of merging them, data assimilation, uses the previous short forecast as a first guess and adjusts it toward each observation in proportion to how trustworthy each one is. We return to this in the next lesson. One subtle point is representativeness error: a thermometer on an airport lawn measures one spot, but a model grid box of 10 km is an average over fields, roads, and perhaps a lake. The assimilation system has to allow for that difference.
Common misconceptions
"Satellites see everything, so ground stations are not needed." Satellites measure radiation and infer temperature and humidity; ground and balloon data are the anchor that corrects those estimates. "Radar sees rain on the ground." It sees precipitation in a beam that rises above the ground with distance; evaporation or wind below the beam can make the ground truth differ. "Pressure code 132 means 132 hPa." It is 1013.2 hPa; the leading digits are dropped.
Check your understanding
Quick check · 5 questions
of 5 answered You scored / 5 · perfect!
-
1. What does a radiosonde measure?
A radiosonde carried by a balloon records pressure, temperature and humidity, and GPS tracking gives the wind. -
2. Station-model pressure code 875 means
Codes of 500 or more get a leading 9, so 875 becomes 9875 and then 987.5 hPa. -
3. A geostationary satellite
Its orbital period matches Earth's rotation, so it hovers over a fixed location. -
4. A radar reflectivity of 50 dBZ suggests
Values above about 50 dBZ are associated with very intense rain or hail. -
5. Why are observations merged with a model first guess?
Data assimilation combines the sparse observations with the model's physics to fill the gaps.
Summary
- Observations come from surface stations, balloons, aircraft, radar, satellites and ocean platforms.
- Time is given in UTC; synoptic hours are 00, 06, 12 and 18 UTC.
- The station model packs temperature, dew point, pressure, wind and cloud into a compact symbol.
- Radar reflectivity (dBZ) relates to rain rate through
Z = 200 R^1.6; Doppler velocity reveals rotation. - Geostationary satellites give constant coverage; polar orbiters give detail and microwave soundings.
Track your progress
Create a free account to tick off lessons and pick up where you left off on any device.
of Meteorology lessons completed