


















Lesson 37 of 54 · Forecasting
Ensembles and probability
Learn how ensemble forecasts turn chaos into probabilities, what a 40 percent chance of rain really means, and how to read spaghetti plots and the hurricane cone.
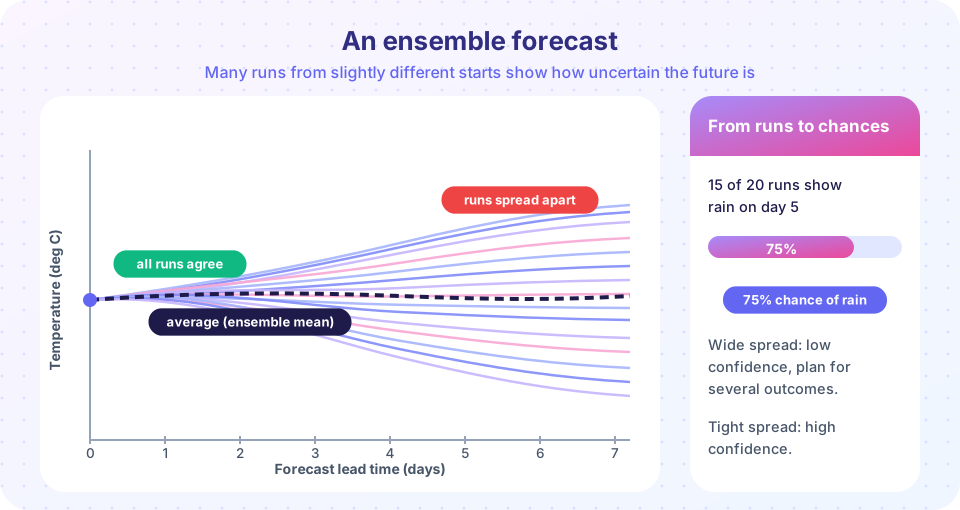
If tiny errors in the starting state can grow until a forecast is useless, a single run of a weather model is a bit like a single roll of a die: informative but not the whole story. Modern forecast centers solve the problem by running the model many times, each time from a slightly different starting point. The set of runs is an ensemble. If the runs all give the same answer, you can be confident. If they scatter, the future is uncertain, and the forecast should say so. This is the idea behind "a 40 percent chance of rain", and it is why a good forecast does not give a single number but a range of possibilities with a likelihood attached.
What you will learn
- Explain how ensembles are produced and what the spread means.
- Compute a probability from ensemble members.
- Interpret "probability of precipitation" correctly.
- Read a spaghetti plot and the hurricane forecast cone.
Key terms
Ensemble is a set of forecasts from slightly different initial states or model versions. Spread is the variation between the members. Probability of precipitation (PoP) is a forecast measure of the chance of measurable rain at a given place. Calibration is the property that events forecast with probability p occur about p of the time. Deterministic forecast is a single best-guess run.
How an ensemble is built
Starting from the best analysis, forecast centers create many slightly different initial states. Each differs by an amount smaller than the uncertainty of the observations, so each is an equally plausible description of the atmosphere now. The perturbations are not random: they are chosen to include the directions in which errors grow fastest, using techniques such as singular vectors or an ensemble of data assimilations. Many ensembles also perturb the model itself, for instance by adding small random changes to the parametrized physics, because the model errors are another source of uncertainty.
Each member is then run forward. Large operational ensembles have around 20 to 50 members: the ECMWF ensemble has 51 (50 perturbed members and one control), and the American GEFS has 31. Ensembles are run at coarser resolution than the single "high-resolution" forecast, because the computing resources must be spread across many runs. Some centers combine ensembles from several models into a multi-model ensemble, which captures differences in model design.
When the members stay close together, the atmosphere is in a predictable state; the forecast is reliable. When they diverge, even a model with perfect physics cannot say what will happen. The divergence is the spread, and a key property of a good ensemble is that large spread goes with large forecast errors and small spread with small errors, a relation called the spread–skill relationship.
From members to probabilities
Once there is an ensemble, probabilities are easy: count the fraction of members that show the event.
P(event) = (members showing the event) / (total members)
If 15 of 20 members give rain on day 5, the ensemble probability is 75 percent. The same members give other statistics: the ensemble mean (the average of all members) tends to be a smoother and more accurate guess than any single run beyond a few days, because the unpredictable parts average out. It also removes sharp features, so the mean of a storm track may look weaker than any real storm. The ensemble median and percentiles give the likely range: the 10th and 90th percentiles of temperature, for instance, bracket the outcomes that most members support.
An ensemble is not automatically calibrated. Real ensembles are often underdispersive (too little spread, so they are overconfident), and forecast centers apply statistical corrections that adjust the probabilities to match the observed frequencies.
Press Run (or Ctrl + Enter) to see the result here.
Program input · what you'd type while the program runs
Type the answers before you press Run, one per line. Each time the program reads a line (with input()), it gets the next line from this box.
What "40 percent chance of rain" means
The probability of precipitation (PoP) is one of the most misunderstood numbers in everyday life. Different agencies word the definition slightly differently, but the most common versions are these:
- For a single location. If the forecast were made for 100 days with identical conditions, rain (a measurable amount, such as 0.25 mm) would fall at that point on about 40 of them.
- In the United States the National Weather Service defines PoP as the product of two things:
PoP = C × A, where C is the forecaster's confidence that measurable rain will fall somewhere in the forecast area and A is the fraction of the area expected to get it. A 40 percent PoP can be 100 percent sure that rain will fall on 40 percent of the area, or 40 percent sure that rain will fall on all of the area, or something in between.
PoP says nothing about how hard or for how long it will rain. A 40 percent chance can mean a thunderstorm, and a 90 percent chance can mean a drizzle. The right use of PoP is as a decision tool: if rain would ruin your picnic, the probability tells you the chance of that outcome.
Reading spaghetti plots and the hurricane cone
Forecasters often show ensembles as spaghetti plots: each member is a thin line (for example a contour of 500 hPa height or the track of a hurricane). Where the lines run together the forecast is confident, and where they fan out it is not. When the lines separate into two distinct bundles, the forecast is bimodal: there are two plausible scenarios, and the average between them might not occur at all.
The cone of uncertainty around the forecast track of a tropical cyclone is an application of the same idea. The cone is built from the historical errors of past official forecasts so that, roughly two-thirds of the time, the center of the storm stays within it. Three cautions apply. The cone shows only the likely position of the center and not the size of the storm: rain, wind and storm surge can reach far outside it. About a third of the time the center ends up outside. And the cone grows with time because errors grow with time, not because the storm itself grows.
Common misconceptions
"A 30 percent chance of rain means it will rain 30 percent of the time." It is a probability of occurrence, not a duration or intensity. "If the forecast says 70 percent and it did not rain, the forecast was wrong." A single outcome cannot judge a probability; calibration is judged over many forecasts. "The ensemble mean is the most likely outcome." It can be a blurry average that no single member shows.
Check your understanding
Quick check · 5 questions
of 5 answered You scored / 5 · perfect!
-
1. In an ensemble, 12 of 30 members forecast frost. The probability is
12 divided by 30 is 0.4, or 40 percent. -
2. Large ensemble spread means
When members disagree, the atmosphere is in a hard-to-predict state, so confidence is lower. -
3. The US definition of PoP is
PoP equals C times A, the product of confidence and area coverage. -
4. The hurricane forecast cone shows
The cone is derived from past track errors. Hazards can extend far beyond it. -
5. Why does the ensemble mean often beat a single member at long range?
At long range the members differ in unpredictable details, and the mean filters them out.
Summary
- An ensemble is a set of forecasts from slightly different starting states, run to measure uncertainty.
- Probabilities come from the fraction of members that show the event.
- Spread tells you how confident to be, and ensemble means smooth out unpredictable details.
- PoP is a probability of measurable rain, not a duration or intensity.
- Spaghetti plots and the hurricane cone are visual ways of showing ensemble information.
Track your progress
Create a free account to tick off lessons and pick up where you left off on any device.
of Meteorology lessons completed