


















Lesson 34 of 54 · Forecasting
Chapter overview: Forecasting
Preview chapter 7 of the meteorology course: how observations, computer models, ensembles and verification combine to make and judge a weather forecast.
A century ago a weather forecast was an educated guess made by a person looking at a handful of telegraphed observations and a hand-drawn map. Today a forecast is the product of a global machine: millions of measurements per day, some of the largest supercomputers on Earth, dozens of parallel simulations, and human experts who decide how to turn all of that into a sentence you can use. And it works. Skill scores published by large forecast centers suggest that the useful range of a forecast has grown by roughly a day per decade. This chapter shows how that machine is built, what its limits are and how to judge whether a forecast is any good.
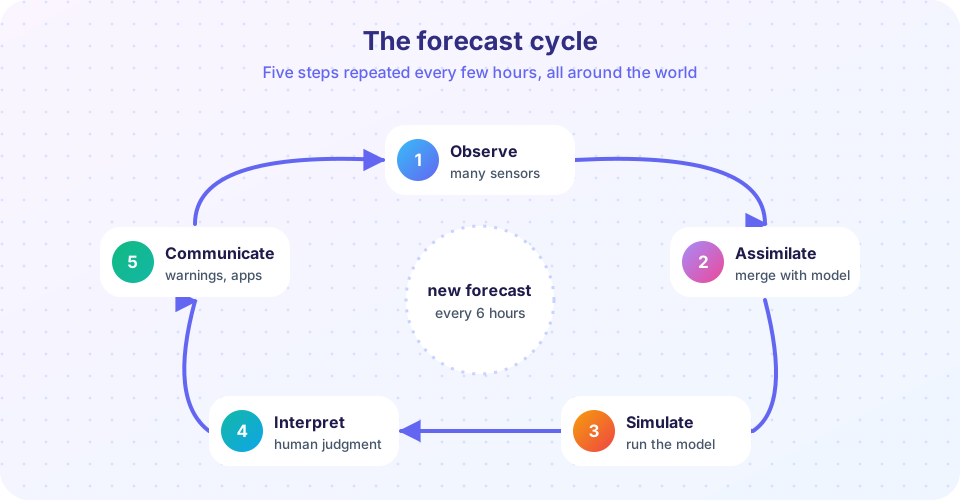
The big picture
The central idea of modern forecasting is simple to state. The atmosphere obeys physical laws, so if we know its state now and can solve the equations that govern it, we can calculate its state in the future. This is numerical weather prediction (NWP). In practice there are three obstacles, and each one has a section of this chapter.
- We never know the state exactly. Observations are sparse, noisy and unevenly spread, so the first job is to build the best possible picture of the atmosphere right now. That is the topic of the lesson on observations.
- The equations cannot be solved exactly. They must be approximated on a grid with a finite resolution and with simplified treatments of processes too small to see, such as individual clouds. Computing power limits how fine the grid can be. This is the lesson on numerical models.
- The atmosphere is chaotic. Tiny errors in the starting state grow until, after about two weeks, a forecast is no better than a guess. Because of that, a forecast should not be one number but a range of possibilities. This is the lesson on ensembles.
A fourth question comes after the forecast is made: was it any good? The last content lesson explains how forecasts are verified and why a forecast with skill can still be useless to a particular user.
Start with the state
The model is only as good as its start.
Compute the future
Measure the doubt
Check the result
What each lesson covers
- Observing the atmosphere covers surface stations, weather balloons, radar, satellites and aircraft, the station model on a surface map, and how radar reflectivity relates to rain.
- Numerical weather prediction tells the story from Richardson's dream to modern supercomputers, explains grids, parametrization and data assimilation, and demonstrates chaos with the Lorenz system.
- Ensembles and probability shows how perturbed runs give a spread and a probability, and what "40% chance of rain" really means.
- Verifying forecasts and skill introduces hit rate, false alarms, the Brier score and skill against a baseline, and the idea of forecast value.
- Chapter review pulls the pieces together with ten questions.
A first measure of skill
The simplest forecast of all is persistence: tomorrow will be like today. It is a surprisingly hard baseline to beat for a day or two, and it is the first test any new forecast method must pass. The example below compares a persistence forecast with a trivial "climatology" forecast on a short made-up series of daily temperatures. The numbers are invented to illustrate the idea, not real measurements.
Press Run (or Ctrl + Enter) to see the console output here.
No output.
Check your understanding
Quick check · 3 questions
of 3 answered You scored / 3 · perfect!
-
1. What is numerical weather prediction?
NWP integrates the equations of atmospheric motion and thermodynamics forward in time from an estimated current state. -
2. Why can forecasts not be accurate beyond about two weeks?
Small errors in the initial state grow exponentially, which limits the range of deterministic predictability. -
3. A persistence forecast says
Persistence is the simplest baseline forecast, and good forecasts must beat it.
Summary
- Forecasting combines observation, a physics-based model, ensemble spread and verification.
- The model needs a good estimate of the current state, which comes from merging observations with an earlier forecast.
- Chaos limits predictability to about two weeks and makes probability essential.
- Persistence and climatology are baselines that real forecasts must beat.
Next: Observing the atmosphere
Track your progress
Create a free account to tick off lessons and pick up where you left off on any device.
of Meteorology lessons completed