


















Lesson 38 of 54 · Forecasting
Verifying forecasts and skill
Learn how forecasts are verified with contingency tables, hit rate, false alarm ratio, the Brier score and skill scores, and why a good forecast is not always valuable.
Everybody has an opinion about the weather forecast, usually based on the last time it went wrong. Verification replaces anecdote with measurement. It lets forecast centers show that models are improving, lets forecasters learn which situations they handle badly, and lets users decide how much trust to place in a forecast. It is also full of traps. A forecast that is right 98 percent of the time can be worthless, and a forecast that sounds wrong on one day can be perfect. In this lesson you will learn the standard measures, the idea of skill relative to a simple baseline, and the difference between a forecast being good and being useful.
What you will learn
- Build a contingency table and compute hit rate, false alarm ratio and the threat score.
- Calculate the Brier score and a skill score against a baseline.
- Explain why accuracy can mislead for rare events.
- Use a cost-loss argument to decide whether a forecast is useful.
Key terms
Hit rate (POD) is the fraction of observed events that were forecast. False alarm ratio (FAR) is the fraction of forecast events that did not occur. Brier score is the mean squared error of probability forecasts. Skill score measures improvement over a reference forecast. Reliability is the agreement between forecast probability and observed frequency.
The contingency table
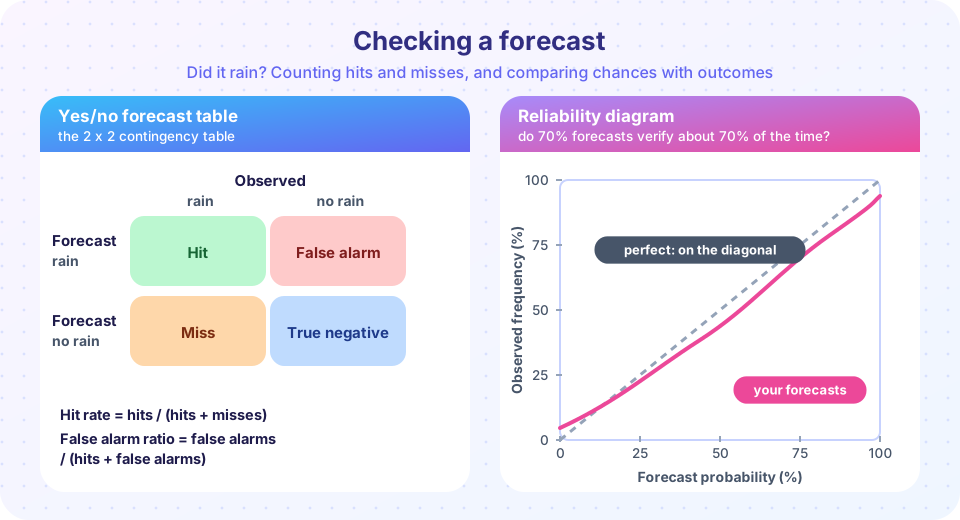
Take a yes/no question such as "will it rain tomorrow at the airport?" Each day gives one of four outcomes.
| Event observed | Event not observed | |
|---|---|---|
| Forecast yes | Hit (a) | False alarm (b) |
| Forecast no | Miss (c) | Correct negative (d) |
From the four counts, the standard measures are:
- Hit rate (probability of detection):
POD = a / (a + c). Of all the times it rained, how often had you said so? A perfect score is 1. - False alarm ratio:
FAR = b / (a + b). Of all the times you said it would rain, how often did it not? A perfect score is 0. - Bias:
(a + b) / (a + c). Do you forecast the event too often (above 1) or too rarely (below 1)? - Threat score (critical success index):
CSI = a / (a + b + c). It ignores the correct negatives, which makes it suitable for rare events. - Accuracy (proportion correct):
(a + d) / n. The simplest, and the most misleading when events are rare.
Why accuracy can mislead
In 1884 a U.S. Army sergeant named John Finley published tornado forecasts for the central United States and claimed a success rate of over 95 percent. A critic then pointed out that someone who simply forecast "no tornado" every time would have scored even higher, because tornadoes are rare. The episode is the textbook case of why verification needs more than percent correct. The code below uses Finley's published counts to see it for yourself.
Press Run (or Ctrl + Enter) to see the result here.
Program input · what you'd type while the program runs
Type the answers before you press Run, one per line. Each time the program reads a line (with input()), it gets the next line from this box.
Probability forecasts: the Brier score and reliability
A probability forecast cannot be right or wrong on one day, so it is scored over many days. The standard measure is the Brier score, the mean squared difference between the forecast probability p (from 0 to 1) and the outcome o (1 if the event occurred, 0 if not):
BS = (1/N) Σ (p − o)²
A perfect forecast scores 0, and always forecasting 50 percent scores 0.25. Because the score punishes confident mistakes (forecasting 90 percent and seeing no event costs 0.81 on that day), forecasters have an incentive to state their real beliefs. The score has a convenient companion, the Brier skill score, which compares to a reference forecast, typically climatology (always forecast the long-term frequency c of the event, which has a Brier score of c(1 − c)):
BSS = 1 − BS / BS_ref
A BSS of 0 means no better than the reference, 1 means perfect, and negative values mean worse. Many other skill scores work the same way. The anomaly correlation coefficient compares the forecast pattern of the 500 hPa height with the observed pattern after removing the climatological mean, and forecast centers use it to track how many days ahead a forecast stays above a threshold such as 0.6 or 0.8.
Reliability is a separate virtue. Collect all the days on which you forecast 70 percent and check how often the event occurred. If it is about 70 percent, the forecasts are reliable (calibrated). On a reliability diagram the points then fall along the diagonal. Points below the diagonal mean overconfident forecasts; points above mean underconfident ones.
Press Run (or Ctrl + Enter) to see the result here.
Program input · what you'd type while the program runs
Type the answers before you press Run, one per line. Each time the program reads a line (with input()), it gets the next line from this box.
Good is not the same as useful
The American meteorologist Allan Murphy argued that "goodness" of a forecast has three separate aspects. Consistency means that the forecast agrees with the forecaster's real belief. Quality is the match between forecast and observation, which the scores above measure. Value is the benefit the forecast gives to a decision-maker. Value depends on the user, not only on the forecast.
The classic way to see it is the cost-loss model. A farmer can protect an orchard from frost by running heaters at a cost C. If frost occurs and the orchard is unprotected, the loss is L. If the probability of frost is p, then:
- never protecting costs
p × Lon average, - always protecting costs
C, - so protecting is worth it whenever
p > C / L.
A user with a cheap protective action (C/L = 0.05) should act on almost any warning, accepting many false alarms. A user with an expensive protective action (C/L = 0.5) should act only when the probability is above half. The same probabilistic forecast therefore serves both, whereas a yes/no forecast fits only one of them. This is one of the strongest arguments for giving users probabilities.
Skill, trends and humility
A forecast has skill only if it beats a simple reference. Common references are persistence (good for a day or so), climatology (good beyond a week or two), and the previous version of the same model. Skill scores of the major global models have improved steadily for decades, and the commonly quoted summary is a gain of roughly one extra day of useful range per decade. At the same time, individual forecasts will always fail sometimes, and rare high-impact events are the hardest to verify because there are so few of them. Good verification therefore uses many cases, several measures and honest baselines.
Common misconceptions
"A forecast that is right 95 percent of the time is a good forecast." If the event happens 5 percent of the time, "never" is right 95 percent of the time. "A 20 percent chance that happens means the forecast was wrong." One event cannot refute a probability. "More false alarms always mean a worse forecast." For users with a low cost-loss ratio, a few false alarms are an acceptable price for catching nearly every event.
Check your understanding
Quick check · 5 questions
of 5 answered You scored / 5 · perfect!
-
1. Of 50 observed frost events, a forecaster had said 'frost' 40 times. The hit rate is
POD is hits divided by observed events: 40 / 50 = 0.80. -
2. A forecaster predicts 90% rain and it stays dry. Their Brier contribution that day is
(0.9 - 0)^2 = 0.81. -
3. A cost-loss ratio of 0.1 means you should protect when the probability exceeds
Protect when p is greater than C/L, which is 0.1 here. -
4. Why is percent correct a poor measure for rare events?
The many correct negatives dominate the score, so a useless 'never' forecast looks excellent. -
5. A Brier skill score of 0 means the forecast is
BSS = 1 - BS / BS_ref, which is 0 when the two scores are equal.
Summary
- A contingency table gives hits, false alarms, misses and correct negatives; from it come POD, FAR, bias and CSI.
- Accuracy is misleading for rare events, as Finley's tornado forecasts showed.
- The Brier score rewards honest probabilities, and a skill score compares with a baseline.
- Reliability checks whether forecast probabilities match observed frequencies.
- Value depends on the user: protect when the probability exceeds the cost-loss ratio.
Track your progress
Create a free account to tick off lessons and pick up where you left off on any device.
of Meteorology lessons completed