


















Lesson 5 of 54 · Getting Started
Chapter 1 review: getting started with meteorology
Review chapter 1 of the meteorology course: weather and climate, instruments, units and the station model, with a one-page summary picture and a ten-question quiz.
You now have the basic toolkit of meteorology: you can tell weather from climate, you know how the main variables are measured, and you can read the compact symbols on a weather map. This review gathers the chapter on one page, gives you code to check your calculations, and ends with a longer quiz that mixes all four lessons.
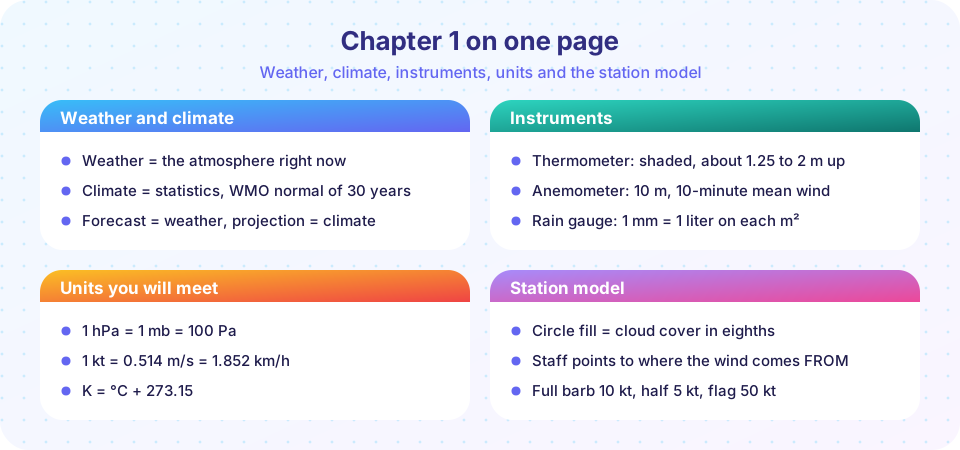
What you will learn
- How the ideas of the chapter fit together
- Which calculations you should now be able to do by hand
- Where your understanding is still shaky, so you can revisit the lesson
The chapter in a table
| Lesson | Core idea | Number or rule to remember |
|---|---|---|
| Course map | Meteorology rests on energy, water and motion | Nine chapters, from observation to severe weather |
| Weather and climate | Weather is the state now; climate is the statistics | 30-year normal; anomaly = value − normal |
| Observing the weather | Standard exposure makes data comparable | Screen at 1.25 to 2 m; wind at 10 m, 10-minute mean |
| Station models | One symbol packs the key variables | Pressure code + 1000 or 900; barb 10 kt, half 5 kt |
Four calculations you can now do
- An anomaly. If the normal for a month is 14.2 °C and this year was 15.9 °C, the anomaly is 15.9 − 14.2 = +1.7 °C.
- A rain total. 18 tips at 0.2 mm each give 3.6 mm, which is 3.6 liters on every square meter.
- A pressure decode. Code 056 is below 500, so the pressure is 1000 + 5.6 = 1005.6 hPa. Code 912 is above 500, so it is 900 + 91.2 = 991.2 hPa.
- A unit conversion. 20 kt is 20 × 0.514 = 10.3 m/s, and 0 °C is 273.15 K.
Press Run (or Ctrl + Enter) to see the result here.
Program input · what you'd type while the program runs
Type the answers before you press Run, one per line. Each time the program reads a line (with input()), it gets the next line from this box.
Press Run (or Ctrl + Enter) to see the console output here.
No output.
Worked review problems
Work through these on paper before you open the explanations in your head. They use only ideas from this chapter.
Problem 1: how unusual is this July? A station recorded these July mean temperatures in five years: 20.4, 21.8, 19.9, 22.6 and 21.3 °C. The five values sum to 106.0, so the mean is 21.2 °C. The deviations from the mean are −0.8, +0.6, −1.3, +1.4 and +0.1 °C. Squaring them gives 0.64, 0.36, 1.69, 1.96 and 0.01, which add to 4.66. Dividing by n − 1 = 4 gives a variance of 1.165 and a standard deviation of about 1.08 °C. A later July that averages 24.5 °C has an anomaly of +3.3 °C, which is about three standard deviations above the mean, an unusual month. (Five years is far too short for a real climate normal; the numbers only show the method.)
Problem 2: decode a report. A station model shows temperature 5, dew point 4, pressure code 987, a wind staff pointing west with two full barbs and one half barb, and a completely filled circle. The pressure is 900 + 98.7 = 998.7 hPa. The wind comes from the west at 10 + 10 + 5 = 25 kt, which is about 25 × 0.514 = 12.9 m/s. The circle means an overcast sky (8 oktas). The gap between temperature and dew point is only 1 °C, so the air is almost saturated: expect low cloud, drizzle or mist, and no chance of dew-point-driven clearing until the air warms or dries.
Problem 3: rain gauge arithmetic. A gauge has a funnel 20.0 cm across feeding a tube 6.32 cm across. The funnel area is about ten times the tube area, so each millimeter of rain fills the tube to a depth of 10 mm. The observer reads 14 mm in the tube, which means 1.4 mm of rain, or 1.4 liters on every square meter.
Problem 4: convert between units. A pilot reads a pressure of 29.80 inches of mercury. One inch of mercury is 33.864 hPa, so the pressure is 29.80 × 33.864 = 1009.1 hPa. A forecast gives winds of 45 kt, which is 45 × 0.5144 = 23.1 m/s, or 83 km/h.
A study checklist
Tick each item only when you can do it without looking:
- State the difference between weather and climate in one sentence and give an example of each.
- Explain why a 30-year period is used for climate normals.
- Say where a thermometer, an anemometer and a rain gauge should be placed and why.
- Decode the pressure, wind and sky cover on a station model.
- Convert between °C and K, hPa and Pa, knots and m/s.
- Describe what a radiosonde, a weather radar and a satellite each measure.
If any item is shaky, go back to the lesson shown in the table above. The remaining chapters assume all of these.
Explain it in your own words
Understanding is easiest to test by explaining. Try to answer each of these aloud, in two or three sentences, without looking at the lessons. Why does a hot day not prove that the climate is warming? What would go wrong if you measured the air temperature with a thermometer fixed to a sunny wall? Why do meteorologists record the wind as a ten-minute average and also report the gust? What do the temperature and the dew point on a station model tell you about the chance of fog? If you can answer all four, you have the habits of thought that the rest of the course depends on: separate the signal from the noise, ask how a number was measured, and read a compact symbol as a story.
Looking ahead
Chapter 2 shifts the viewpoint from the instruments to the air itself. You will see what the atmosphere is made of, how it is layered by temperature, why pressure falls with height and how the gas law ties pressure, temperature and density together. Those ideas turn the numbers you met here into physics. The pressure code on a station model, for example, becomes the weight of a column of air, and the dew point becomes a statement about the vapor in a parcel. Keep your station model skills handy, because later chapters will ask you to interpret a whole map.
How exam questions on this chapter are usually built
Questions on weather and climate often give a short list of temperatures and ask for a mean, an anomaly or a comment on whether the data can say anything about climate. Questions on instruments ask where to place a sensor and what could go wrong with a poor site, such as a thermometer near a wall or a rain gauge under a tree. Questions on the station model give the symbols and ask for temperature, pressure, wind speed and cloud cover in words. In every case the safest method is the same: write the unit, state what is being measured, say how it was averaged, and then compute.
Where students usually slip
Mixing weather and climate. Check the time scale: one day or week is weather; decades is climate.
Dropping a unit. Remember to write hPa, mm, kt or °C after every number.
Reversing wind direction. Wind direction always names where the wind comes from.
Misreading the pressure code. The code never gives the leading digits; you restore them.
Check your understanding
Quick check · 10 questions
of 10 answered You scored / 10 · perfect!
-
1. Which is a statement about climate?
An annual average over many years is a climate statistic. The others describe specific events. -
2. What is the anomaly if the normal is 8.4 °C and the observation is 6.9 °C?
6.9 - 8.4 = -1.5 °C, so the observed value was below normal. -
3. Why use a 30-year period for climate normals?
A long period reduces noise from natural variability, but a much longer one would blur real change. -
4. At what height is wind speed measured by international convention?
Wind is measured at 10 m above open, level ground, usually as a 10-minute mean. -
5. How much water does 1 mm of rain put on 1 square meter?
1 mm of depth over 1 m² is 0.001 m³ of water, which is 1 liter. -
6. What is 1013.25 hPa in pascals?
1 hPa equals 100 Pa, so 1013.25 hPa is 101,325 Pa. -
7. A wind staff on a station model points to the northeast. The wind is a
The staff points to the direction the wind comes from. A northeasterly wind blows from the northeast toward the southwest. -
8. A pressure code of 934 corresponds to
The code is 500 or more, so you add 900 to 93.4 hPa to get 993.4 hPa. -
9. Which pair of readings suggests fog is likely?
A gap of only 0.5 °C means the air is almost saturated, so a small cooling produces fog. -
10. Which instrument gives a vertical profile of the atmosphere?
A radiosonde measures pressure, temperature, humidity and wind as a balloon rises.
Summary
- Weather is the state of the air now; climate is its long-term statistics, built from 30-year normals and described with anomalies.
- Standard exposure and averaging make observations comparable; radiosondes, radar and satellites add the vertical and the large scale.
- The station model gives temperature, dew point, coded pressure, wind and sky cover in fixed positions.
- Units matter: 1 hPa = 100 Pa, 1 kt = 0.514 m/s, K = °C + 273.15.
- Next you will look at the air itself, its gases, layers and pressure.
Next: The atmosphere: overview
Track your progress
Create a free account to tick off lessons and pick up where you left off on any device.
of Meteorology lessons completed