


















Lesson 44 of 49 · Projects and Practice
Project: The Ocean's Heat and Sea Level
Build a heat and sea level budget for 1970 to 2020 in Python: ocean heat uptake, warming of the upper 2000 m, thermal expansion, ice melt, and a check that the parts add up.
Does the ocean take up enough heat to explain the rise in sea level? It is the kind of question that tests your understanding: the answer needs heat capacity, thermal expansion, the conversion from ice mass to millimeters and a feel for the size of the numbers. In this project you will build the budget yourself, one step at a time, and check whether the parts add up to the total that tide gauges and satellites measure.
The inputs are synthetic, chosen to be of the right size and shape, so you can change them and see what happens. The aim is not to produce a research result but to learn how a scientist reasons with a budget.
What you will learn
- How to turn an ocean heat uptake in W/m² into joules, a temperature change and a sea level change
- How to convert ice loss in gigatonnes to millimeters
- How to build and plot a budget, and what closure means
- How sensitive the answer is to the assumptions
Key terms
Zettajoule (ZJ): 10²¹ joules, a convenient unit for ocean heat content.
Ocean heat uptake (N): the net heat flux into the ocean, in W/m² of ocean or of Earth's surface.
Effective expansion coefficient: the single value of α that gives the right thermal expansion for the whole ocean, which is smaller than the value at the warm surface because most water is cold.
Contribution: the part of the total sea level rise that comes from one source.
Closure: agreement, within uncertainty, between the sum of contributions and the observed total.
Step 1: heat uptake in joules
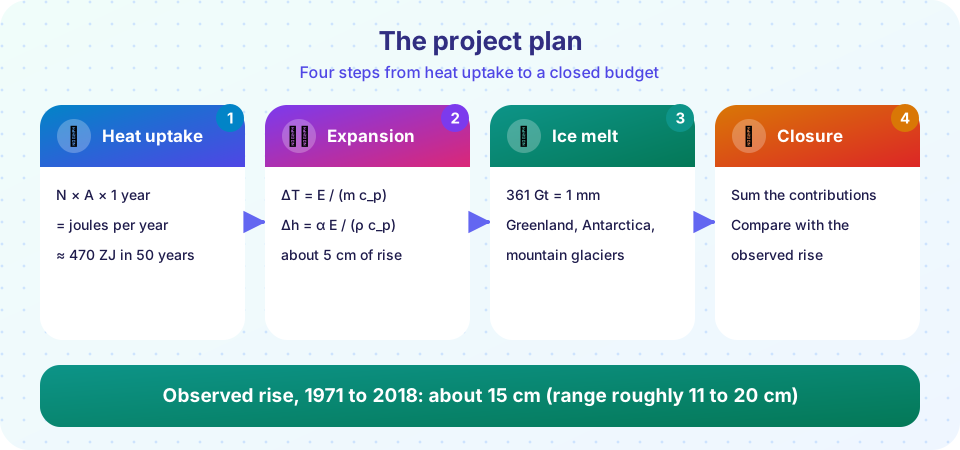
Suppose the heat uptake by the ocean, averaged over the area of the whole Earth (5.10 × 10¹⁴ m²), rose steadily from 0.25 W/m² in 1970 to 0.90 W/m² in 2020. This is a synthetic ramp with the right order of magnitude (observations since the 1970s suggest a few tenths of a watt per square meter early on and about one watt per square meter recently). In one year the energy is N × A_Earth × 3.156 × 10⁷ s. For N = 0.6 W/m², that is 0.6 × 5.10 × 10¹⁴ × 3.156 × 10⁷ = 9.7 × 10²¹ J, or 9.7 ZJ in a year. Adding up the years gives the total heat stored.
Step 2: warming and expansion
Spread the stored heat through the top 2,000 m of the ocean. The volume is 3.61 × 10¹⁴ m² × 2,000 m = 7.2 × 10¹⁷ m³, the mass is about 7.4 × 10²⁰ kg and the temperature rise is ΔT = E / (m c_p). The answer is a small fraction of a degree, a good reminder of why a tiny temperature change hides a huge amount of energy.
For sea level, convert the heat uptake per square meter of ocean (N_ocean = N × A_Earth / A_ocean, which is about 1.41 times larger than N) into a rise: Δh = α N_ocean × (1 year) / (ρ c_p). For the whole-ocean calculation use an effective expansion coefficient of about 1.6 × 10⁻⁴ per °C. The value of α at the warm surface is about 2 × 10⁻⁴, but it is much smaller in cold water, and most of the ocean's water is cold.
Step 3: ice and the sum
Melting land ice adds mass: 361 Gt equals 1 mm. Take three sources with synthetic loss rates that grow over the period: Greenland (to 270 Gt/yr), Antarctica (to 150 Gt/yr) and mountain glaciers (from 150 to 270 Gt/yr). Sum all the contributions and compare with an observed rise of roughly 15 cm over 1971 to 2018 according to the IPCC assessment (uncertainty range roughly 11 to 20 cm). Remember that land water storage and other small terms exist too.
The code
The first listing builds the budget, prints the key numbers and draws the two-panel figure. Run it, read the printed numbers, then try the exercises below.
Press Run (or Ctrl + Enter) to see the result here.
Program input · what you'd type while the program runs
Type the answers before you press Run, one per line. Each time the program reads a line (with input()), it gets the next line from this box.
Exercises
Try these changes one at a time and record how the total changes. Writing down a prediction before you run each is the best practice.
- Sensitivity. Set
alphato 2e-4 and then to 1.2e-4. How much does the total change? Which source of uncertainty matters most:alpha, or the ice loss? - Faster ice loss. Double the Greenland and Antarctic loss rates. By how many centimeters does the total rise? How does it compare with the observed range?
- Units check. Show by hand that 1 W/m² of ocean heat uptake for one year gives about 1.5 mm of thermal expansion with
α= 2 × 10⁻⁴. - A different depth. Change the 2,000 m in the warming calculation to 700 m. What happens to the warming
ΔT, and why? - Extension. Run the budget out to 2100 with heat uptake rising to 1.5 W/m² and ice loss doubling. What rate of sea level rise do you find in 2100, and what does it mean for a coastal city?
A what-if calculator
The second example is a small calculator for the exercises, in JavaScript. Given a rate of ice loss and heat uptake, it tells you the rate of sea level rise and how long it takes to reach a target height. Change the numbers.
Press Run (or Ctrl + Enter) to see the console output here.
No output.
Interpreting the result
If you ran the budget as written, you will find about 10 cm of sea level rise over 1970 to 2020: roughly half from thermal expansion (5 cm), 3 cm from glaciers and 2 cm from the two ice sheets, with a rate of about 3.5 mm per year at the end. That is close to the lower edge of the observed range, which is encouraging for a model with so few knobs. The gap could come from heat stored below 2,000 m, changes in land water storage (groundwater pumping, reservoirs) and the fact that the inputs are smooth, synthetic curves. That the budget approximately closes is itself a finding: it says that the measured heat uptake and the measured ice loss are of the right size to explain the measured sea level. Real analyses go further. They use the actual measured time series rather than a smooth ramp, include all the small terms, and compare the sums with tide gauges and satellite altimetry (chapter 8). When a budget fails to close, that is a sign that a term is missing, and tracking it down has led to real discoveries.
Common misconceptions
"A budget that matches proves the model is perfect." It shows that the parts are consistent with the total, not that each part is right; errors can cancel.
"The temperature change of 0.16 K is too small to matter." Spread over a huge mass, it is an enormous energy and a measurable sea level rise.
"Only ice melts raise sea level." Thermal expansion contributes about as much.
Check your understanding
Quick check · 4 questions
of 4 answered You scored / 4 · perfect!
-
1. Why is the temperature change of the top 2,000 m so small even though the heat stored is huge?
Spreading about 5 × 10²³ J over 7 × 10²⁰ kg gives only a fraction of a degree. -
2. Which conversion turns ice loss into sea level?
The ocean's area is 3.61 × 10¹⁴ m²; 1 mm needs 3.61 × 10¹⁴ kg of water, or 361 Gt. -
3. Why use an 'effective' α of about 1.6 × 10⁻⁴ for the whole ocean?
α rises with temperature, so the volume-weighted average is smaller than the surface value. -
4. If the budget does not close, what is the best next step?
Mismatches usually reveal a mistake or a missing term.
Summary
- Heat uptake in W/m² converts to joules, a temperature change and a thermal expansion with
Δh = α E / (ρ c_p). - Ice loss converts to sea level at 361 Gt per millimeter.
- A budget adds the contributions and compares them with the observed rise; agreement is called closure.
- Sensitivity runs show which assumptions matter most.
Track your progress
Create a free account to tick off lessons and pick up where you left off on any device.
of Oceanography lessons completed