


















Lesson 26 of 49 · Ocean-Atmosphere Interaction
El Niño and the Southern Oscillation
Understand ENSO: how weakening trade winds let the Pacific warm pool slide east, why the thermocline flattens, how the ONI is calculated and what El Niño does to weather and fisheries.
Every few years, around Christmas, fishermen off the coast of Peru notice that the sea turns unusually warm and the fish go away. They called it El Niño, "the Christ child", because it arrived at Christmastime. For a long time it was seen as a local nuisance. Then, in the twentieth century, scientists discovered that the warm water is one half of a pattern that stretches across the entire tropical Pacific and rearranges rainfall on every continent.
This lesson explains that pattern, called ENSO (El Niño-Southern Oscillation). It is the best-known example of an ocean-atmosphere partnership: the ocean's temperature changes the winds, and the winds change the ocean's temperature. You will see how it works, how it is measured and what it does to people.
What you will learn
- The normal state of the tropical Pacific: warm pool, cold tongue, trade winds, thermocline tilt
- How the Bjerknes feedback makes the Pacific swing into El Niño or La Niña
- How the Oceanic Niño Index (ONI) defines an event
- Typical impacts of El Niño and La Niña on rainfall, fisheries and temperature
- Why ocean waves, not just winds, set the timing of the cycle
Key terms
Walker circulation: the east-west loop of air over the equatorial Pacific: rising over the warm west, sinking over the cool east.
Thermocline: the layer where temperature falls quickly with depth (chapter 3); in the tropical Pacific it is deep in the west and shallow in the east.
Niño 3.4 region: the box 5°N to 5°S, 170°W to 120°W, whose SST anomaly defines ENSO.
Bjerknes feedback: a positive feedback between SST differences across the Pacific and the strength of the trade winds.
Kelvin wave: a wave trapped along the equator that carries a thermocline disturbance eastward.
The normal state
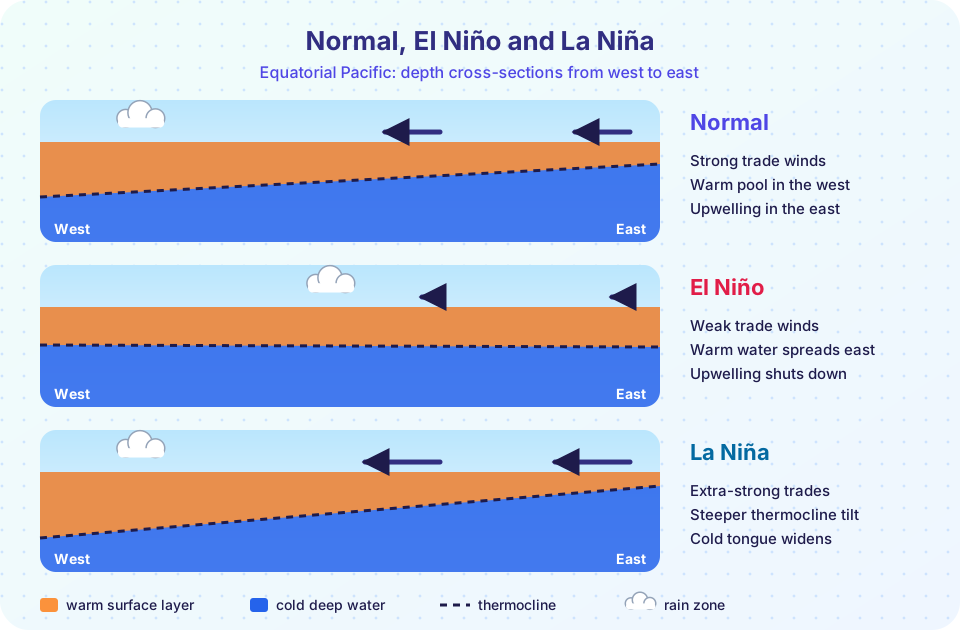
In a typical year the trade winds blow from east to west across the equatorial Pacific at several meters per second. They drag surface water westward and pile it up: the sea surface is about half a meter higher in the far west than in the east, and the warmest water on Earth, the warm pool, collects around Indonesia and New Guinea with SSTs above 28 °C. Air above it rises and rains heavily.
The warm layer is deep in the west (the thermocline is 150 to 200 m down) but shallow in the east (about 50 m). Along the equator off Peru and Ecuador the winds also drive upwelling: cold, nutrient-rich water rises to the surface to form the cold tongue with SSTs near 22 to 24 °C. This upwelling fuels the world's largest single fishery, for the Peruvian anchoveta (chapter 6).
Air completes the loop: it rises over the warm pool, flows eastward aloft, sinks over the cool east and returns westward as the trades. This loop is the Walker circulation, named for Sir Gilbert Walker, who in the 1920s studied the see-saw of air pressure between Darwin and Tahiti and named it the Southern Oscillation.
The Bjerknes feedback
In 1969 the Norwegian-American meteorologist Jacob Bjerknes saw that the ocean and the atmosphere reinforce each other.
- Suppose the trades weaken a little, for any reason.
- Less warm water is pushed west, and less cold water upwells in the east, so the east warms.
- A warmer east reduces the east-west temperature difference. The Walker circulation weakens, and the trades weaken further.
- This pushes the warm pool still farther east, returning to step 2.
That is a positive feedback: a small change grows. It is why the Pacific can flip into El Niño within a few months. The same feedback in reverse produces La Niña: stronger trades, more upwelling, a colder east, a still larger temperature contrast and even stronger trades.
A positive feedback alone would run away. Something has to turn each event around. The answer lies in the ocean's own waves.
Waves that set the clock
When the winds weaken, they release the water piled up in the west. The release launches an eastward-traveling equatorial Kelvin wave that deepens the thermocline as it crosses the Pacific. Its speed is c = √(g′ H), where H is the upper-layer thickness (about 150 m) and g′ is the reduced gravity (about 0.04 m/s², since the density difference between the layers is small). That gives about 2.4 m/s, so the wave crosses the 16,000 km Pacific in roughly 80 days. Meanwhile westward-traveling Rossby waves reflect off the western boundary and come back as Kelvin waves of the opposite sign that can eventually end the event. This "delayed" return gives ENSO its irregular rhythm of 2 to 7 years.
Measuring ENSO
Scientists track the Oceanic Niño Index (ONI): the 3-month running mean of the SST anomaly in the Niño 3.4 region, compared with a 30-year average. By the standard U.S. definition:
- El Niño is declared when the ONI is at least +0.5 °C for five consecutive overlapping 3-month periods.
- La Niña is declared when it is at most −0.5 °C for the same length of time.
- Events are often labeled weak (0.5 to 0.9), moderate (1.0 to 1.4), strong (1.5 to 1.9) or very strong (2.0 or more).
A related measure, the Southern Oscillation Index (SOI), is based on the standardized pressure difference between Tahiti and Darwin. A strongly negative SOI goes with El Niño.
The strongest events of the satellite era were in 1982-83, 1997-98 and 2015-16. In 1997-98 SSTs in the Niño 3.4 region exceeded normal by more than 2 °C.
What El Niño does
Because heat and moisture move in the atmosphere, a changed pattern of tropical rain shifts the jet streams and storm tracks. These links between distant places are teleconnections. Typical (not guaranteed) El Niño effects:
- Heavy rain along the coasts of Peru and Ecuador, and in the central and eastern Pacific.
- Drought and fires in Indonesia, Australia and parts of southern Africa and northern South America.
- A weaker Indian summer monsoon in many El Niño years.
- Wetter winters in the southern United States and drier conditions in the Pacific Northwest.
- A collapse in anchoveta catches off Peru as upwelling brings warm, nutrient-poor water (a fishery crisis in 1972-73 is the classic example).
- A warmer global average temperature, as the Pacific releases stored heat to the air: 1998 and 2016 both set records.
La Niña tends to bring the opposite: a good year for Peruvian fish, more Atlantic hurricanes, and drought in the southern United States and east Africa. These are tendencies, not guarantees: each event is different, and other patterns also affect the weather. Seasonal forecasts give odds, not certainties.
Common misconceptions
"El Niño is a one-off disaster." It is a recurring part of the climate system, and for most of the time the Pacific is in neither state ("neutral").
"El Niño means warm water everywhere." Only part of the Pacific warms. The western Pacific becomes cooler than normal at the same time.
"ENSO is caused by climate change." ENSO existed long before. Research asks whether warming changes its strength, pattern or impacts, and the answers are still debated.
Try it
The first example is an ENSO event detector. It builds a made-up monthly Niño 3.4 series (a noisy oscillation, generated by random numbers: this is a demonstration series, not real data), smooths it with a 3-month running mean and applies the ONI rule of five consecutive months.
Press Run (or Ctrl + Enter) to see the result here.
Program input · what you'd type while the program runs
Type the answers before you press Run, one per line. Each time the program reads a line (with input()), it gets the next line from this box.
The second example computes how long an equatorial Kelvin wave takes to cross the Pacific. Try other values for the upper-layer thickness and the density contrast.
Press Run (or Ctrl + Enter) to see the console output here.
No output.
The third example is an interactive picture of the three states. Click a button to move the thermocline and change the wind arrows. It is a schematic that shows the pattern, not a model that makes predictions.
Check your understanding
Quick check · 5 questions
of 5 answered You scored / 5 · perfect!
-
1. Which description matches the normal state of the equatorial Pacific?
Trade winds pile warm water up in the west and drive cold upwelling in the east. -
2. The Bjerknes feedback is positive because...
A small change in either the winds or the SST gradient is amplified by the other. -
3. An El Niño is declared (by the ONI definition) when the Niño 3.4 SST anomaly is at least +0.5 °C for how long?
The ONI rule needs a sustained warm anomaly, five overlapping 3-month means in a row. -
4. A Kelvin wave with g′ = 0.04 m/s² in a layer 150 m thick travels at about...
c = √(0.04 × 150) = √6 ≈ 2.4 m/s. -
5. What typically happens to Peruvian anchoveta catches in a strong El Niño?
Warm water suppresses the upwelling of nutrients that feeds the fish's food chain.
Summary
- Normally the trade winds pile warm water in the western Pacific and upwelling cools the east; the thermocline tilts across the basin.
- The Bjerknes feedback between SST contrast and wind strength lets the Pacific flip into El Niño or La Niña.
- Kelvin and Rossby waves set the delayed return and the irregular 2 to 7 year rhythm.
- The ONI (Niño 3.4 anomaly of at least ±0.5 °C for five overlapping 3-month periods) defines events.
- Teleconnections spread the effects to rainfall, fisheries and global temperature, as tendencies rather than certainties.
Next: Hurricanes and Monsoons
Track your progress
Create a free account to tick off lessons and pick up where you left off on any device.
of Oceanography lessons completed