


















Lesson 31 of 49 · Marine Life and Ecosystems
Food Webs and Energy Flow
Follow energy from phytoplankton to whales: trophic levels, the 10% rule, the microbial loop, marine snow, diel migration and the biological pump that carries carbon into the deep.
A blue whale, the largest animal that has ever lived, feeds on animals the size of a paper clip. An Atlantic bluefin tuna eats mackerel that ate smaller fish that ate copepods that ate phytoplankton. Every one of these links costs energy, and the cost explains almost everything about the shape of marine ecosystems: why top predators are rare, why a short food chain feeds more mouths than a long one, and why the open ocean gives a thin catch while an upwelling zone gives a rich one.
This lesson follows the energy and the carbon. First up the food web, as larger animals eat smaller ones. Then down, as dead cells, shells and waste sink into the deep and take carbon with them: the biological pump.
What you will learn
- What trophic levels are and why only about 10% of energy passes up each step
- How the length of a food chain controls how much fish a sea can produce
- What the microbial loop is and why it dominates in the open ocean
- How the biological pump moves carbon into the deep ocean, and how fast flux decays with depth
- What diel vertical migration is
Key terms
Trophic level: a feeding position in a food chain: 1 for producers, 2 for herbivores, 3 for carnivores that eat herbivores, and so on.
Trophic efficiency: the fraction of energy at one level that is converted into growth at the next, typically 5 to 20%, often taken as 10%.
Microbial loop: the cycle in which bacteria use dissolved organic matter and are eaten by tiny grazers, recycling nutrients in the surface layer.
Biological pump: the transfer of carbon from the surface to the deep ocean by sinking organic particles.
Marine snow: a continuous shower of dead cells, fecal pellets and aggregates falling through the water.
Climbing the food chain
Energy enters the web as sunlight and is captured by phytoplankton (trophic level 1). Zooplankton such as copepods graze on them (level 2). Small fish and squid eat the zooplankton (level 3); larger fish, seabirds and seals eat those (level 4); and sharks, tunas, orcas and polar bears sit at the top (level 4 to 5).
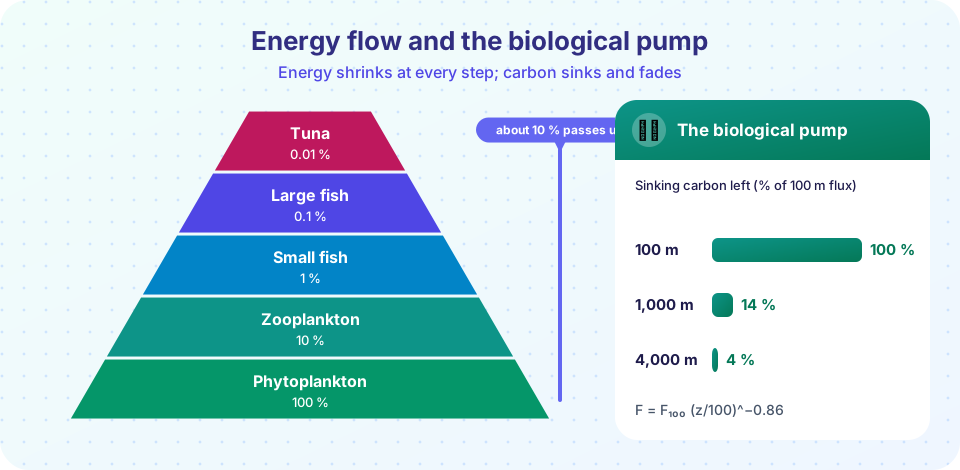
At each step most of the energy disappears. An animal does not turn everything it eats into new body: much is spent on respiration (movement, keeping warm, running the body) and is lost as heat; some is not digested and leaves as waste; and some of the prey is never eaten, because it dies or escapes. On average only about 10% of the energy available at one level ends up as new tissue at the next. This rule of thumb goes back to Raymond Lindeman's 1942 study of a lake, and measured values range from about 5% to 20%.
Worked example: how much tuna?
Suppose a patch of ocean produces 1,000,000 kg of phytoplankton carbon per year, and each step passes on 10%:
| Level | Organisms | Carbon (kg per year) |
|---|---|---|
| 1 | Phytoplankton | 1,000,000 |
| 2 | Copepods | 100,000 |
| 3 | Small fish | 10,000 |
| 4 | Larger fish | 1,000 |
| 5 | Tuna | 100 |
Ten thousand times less goes to tuna than to plankton. Take one level out of the chain, as happens in a cold upwelling zone where large diatoms are eaten directly by anchovies (levels 1, 2 and 3), and the fish get ten times more. This is why the Peruvian anchoveta fishery, with its short food chain, is the largest single fishery in the world, and why the open-ocean tuna, with five or more levels, are scarce.
A surprising result also follows. In the sea, the biomass pyramid can be upside down: at one instant there can be less phytoplankton than zooplankton, because phytoplankton reproduce within a day or two while zooplankton live for weeks. It is the energy flow pyramid that is always wide at the bottom.
Webs, not chains
Real ecosystems are webs: most animals eat several kinds of food and change diets as they grow. A young cod eats plankton, an adult cod eats herring. The "level" of an animal is therefore a number between whole values, called its mean trophic level. The Antarctic food web is relatively simple: phytoplankton feed krill (Euphausia superba, whose total biomass is on the scale of hundreds of millions of tonnes), and krill feed penguins, seals, fish and baleen whales. A blue whale in the feeding season can eat several tonnes of krill a day.
Top predators can control the whole structure. In the kelp forests of the North Pacific, sea otters eat sea urchins; where otters were hunted out in the nineteenth century, urchins multiplied and grazed the kelp down to bare "urchin barrens". When otters return, kelp comes back. This kind of top-down domino effect is called a trophic cascade.
The microbial loop
In the open ocean, much of the primary production leaks out of cells as dissolved organic matter, or is released when cells are broken open. In the 1980s Farooq Azam and colleagues showed that bacteria take up a large part of this dissolved material. The bacteria are in turn eaten by tiny flagellates and ciliates, which are eaten by larger zooplankton. This microbial loop keeps nutrients circulating in the surface layer and passes some energy up to larger animals. In the nutrient-poor gyres, where cells are small, most of the energy flows through the loop and almost none reaches fish. That is a major reason why these waters support relatively little fishing.
The biological pump
Some of the carbon fixed by phytoplankton does not go up the food web at all. Dead cells, shells, aggregates and fecal pellets from zooplankton fall slowly through the water as marine snow. Most of this material is eaten and respired by bacteria within a few hundred meters, releasing the carbon dioxide and nutrients back into the water. But a fraction sinks deep, and what reaches the seafloor is buried in sediments (chapter 2). Overall, this export carries roughly 5 to 12 billion tonnes of carbon per year out of the sunlit layer. This is the biological pump, and it is one of the reasons the ocean contains about 50 times as much carbon as the atmosphere. Without it, atmospheric carbon dioxide would be much higher.
The flux of sinking carbon falls quickly with depth. A well-known empirical curve, found by John Martin and colleagues in 1987 from sediment-trap data, says:
F(z) = F₁₀₀ · (z / 100)^(−b), with b about 0.86
where F₁₀₀ is the flux at 100 m and z is depth in meters. At 1,000 m this predicts only about 14% of the 100 m flux; at 4,000 m, only about 4%. The steeper the curve, the more carbon is returned to the water at shallow depth, where it can reach the atmosphere again quickly. The depth at which carbon is respired matters for the climate.
Animals that commute
The pump also includes animals. Every night, enormous numbers of fish, squid and zooplankton rise from the twilight zone (200 to 1,000 m) to feed near the surface under cover of darkness, and they return to the depths at dawn to hide from visual predators. This diel vertical migration is the largest daily movement of animal biomass on Earth. It is visible on ships' echo sounders as the "deep scattering layer" that rises and falls with the Sun (sound reflects from the swim bladders and bodies of the animals). The migrators eat at the surface and release waste and respired carbon dioxide at depth, speeding the pump.
Common misconceptions
"A food chain is a simple line." Real systems are webs with omnivores and changing diets.
"10% means 10% of the animals." The 10% is about energy or carbon, not numbers.
"Everything that sinks reaches the seafloor." Most sinking material is recycled in the upper kilometer.
"More top predators means a healthier sea." Predators are rare when the food chain is long. Their numbers indicate both the productivity of the base and the number of steps.
Try it
The first example computes how much energy reaches each level in food chains of different lengths and with different efficiencies. Change the numbers to see how a few percentage points compound.
Press Run (or Ctrl + Enter) to see the console output here.
No output.
The second example plots the Martin curve, the fraction of sinking carbon left at each depth, for three values of the exponent b. A larger b means material is recycled sooner. The curve is an empirical fit, not a law of nature.
Press Run (or Ctrl + Enter) to see the result here.
Program input · what you'd type while the program runs
Type the answers before you press Run, one per line. Each time the program reads a line (with input()), it gets the next line from this box.
Check your understanding
Quick check · 5 questions
of 5 answered You scored / 5 · perfect!
-
1. If each step in a food chain passes on 10% of the energy, how does energy at level 4 compare with level 1?
Three steps: 0.1 × 0.1 × 0.1 = 0.001, or 0.1%. -
2. Why does a short food chain, as in the Peruvian upwelling, support a large fishery?
Each trophic step loses about 90% of the energy, so removing a step multiplies the fish yield by about ten. -
3. What does the biological pump do?
Dead cells, shells and fecal pellets carry carbon to depth, where some of it stays for centuries. -
4. In the Martin curve with b = 0.86, about what fraction of the 100 m flux reaches 1,000 m?
(1000/100)^(−0.86) = 10^(−0.86) ≈ 0.14. -
5. Diel vertical migration is...
Animals of the twilight zone rise at dusk and descend at dawn.
Summary
- Only about 10% of energy passes from one trophic level to the next, so top predators are rare and short chains are productive.
- Marine food webs are tangled; the microbial loop dominates in nutrient-poor water, and trophic cascades show how predators shape ecosystems.
- The biological pump exports 5 to 12 Gt of carbon a year; the flux decays as
(z/100)^(−0.86)with depth. - Migrating animals speed up the transfer of carbon to the deep.
Track your progress
Create a free account to tick off lessons and pick up where you left off on any device.
of Oceanography lessons completed