


















Lesson 37 of 49 · Human Impacts
Fisheries and Overfishing
Learn how fish populations grow, what maximum sustainable yield means, how overfishing and collapses such as Atlantic cod happen, and which management tools help stocks recover.
For most of history, fish seemed to be a gift that could not run out. In 1883 the biologist Thomas Huxley, speaking at a fisheries exhibition in London, argued that the great sea fisheries were inexhaustible: nothing people did could seriously reduce them. A century later, the Atlantic cod off Newfoundland, which had supported fishing fleets for 500 years, disappeared almost overnight. Huxley's confidence had met the arithmetic of population growth.
This lesson uses a simple mathematical model to answer the question that fishers, economists and ecologists all ask: how much can we catch year after year without destroying the stock? The model is simple, but it explains why fisheries collapse, why the signs come late, and what managers can do about it.
What you will learn
- How a fish population grows and what limits it (logistic growth)
- What maximum sustainable yield (MSY) is and how to calculate it
- How overfishing can collapse a stock, with real examples
- The main management tools and their trade-offs
- Where global fisheries stand today
Key terms
Stock: a group of fish of one species in an area that is managed as a unit.
Catch per unit effort (CPUE): the amount of fish caught per hour or per boat, often used as a rough index of abundance.
Maximum sustainable yield (MSY): the largest average catch that can be taken from a stock indefinitely.
Overfishing: fishing so hard that the stock cannot replace what is removed.
Total allowable catch (TAC): the legal limit on the catch of a species in a season.
How a fish population grows
Imagine a fish population with no fishing. When it is very small, there is plenty of food and space, so it grows fast. When it is near the limit that the habitat can support, the carrying capacity K, it stops growing, because food and space run out. The simplest equation that captures this is the logistic model:
dB/dt = r B (1 − B / K)
Here B is the biomass of the stock, r is the maximum growth rate per year (when B is small) and K is the carrying capacity. The growth is highest in the middle, when B = K/2, where the population is large enough to produce many young and still small enough not to run out of food. The maximum growth is r K / 4.
Adding fishing: the Schaefer model
In 1954 Milner Schaefer added a fishing term. If fishing effort is E (boat-days, hours of trawling or similar) and each unit of effort catches a fixed fraction q of the stock (the catchability), then the catch is q E B and:
dB/dt = r B (1 − B / K) − q E B
Setting dB/dt = 0 gives the equilibrium biomass and the sustainable yield for a constant effort:
- Equilibrium biomass:
B* = K (1 − q E / r) - Sustainable yield:
Y = q E B* = q E K (1 − q E / r)
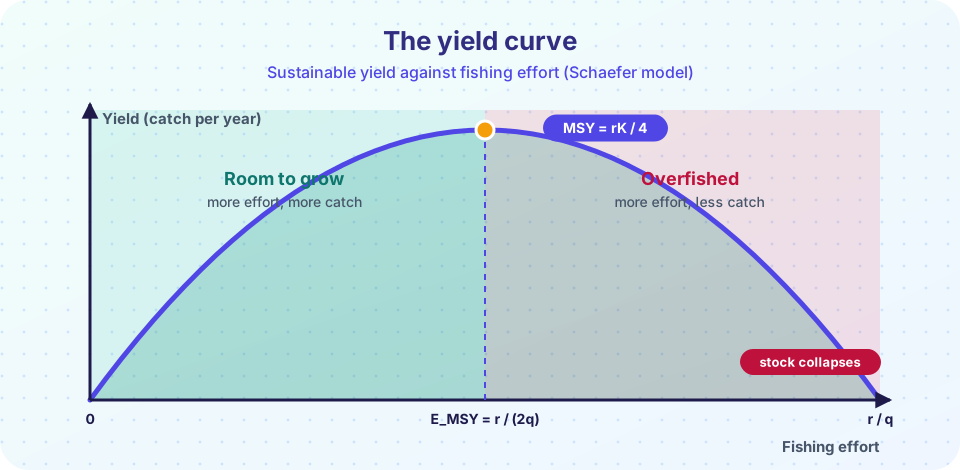
The yield is a parabola in the effort. It rises with effort at first, because more fishing means more catch, then peaks and then falls as the stock shrinks. The top of the parabola is the maximum sustainable yield:
MSY = r K / 4, reached at E_MSY = r / (2 q) and B_MSY = K / 2
If the effort rises above r / q (twice E_MSY), the removal is faster than even the fastest growth, and the stock heads to zero.
Worked example
Take r = 0.4 per year, K = 1,000 thousand tonnes and q = 0.001 per effort unit. Then E_MSY = 0.4 / 0.002 = 200 effort units, B_MSY = 500 and MSY = 0.4 × 1,000 / 4 = 100 thousand tonnes per year. At twice that effort (E = 400), the equilibrium biomass is K (1 − 0.001 × 400 / 0.4) = 0 and there is no sustainable catch at all.
Why the warning comes late
The model hides a trap. Above E_MSY, you catch less each year while working harder. But in the early stages, a bigger fleet can still raise the total catch for a while, by "mining" the accumulated stock, so the decline looks like a temporary fluctuation. Catch per boat falls first, but fish cluster and are easy to find with sonar, so CPUE can stay high even while the stock collapses (a problem called hyperstability). By the time the problem is clear, much of the stock is gone.
Real collapses
Peruvian anchoveta. In 1970 the fishery landed about 12 million tonnes, the largest ever for a single species. A strong El Niño in 1972 to 1973 (chapter 5) cut the stock at the moment that it was being heavily fished, and catches dropped to a small fraction. The stock later recovered and is now a large, tightly managed fishery.
Atlantic cod, Newfoundland. The northern cod stock supported fishing for five centuries. After 1950 large factory trawlers from many countries took more than 800,000 tonnes in the peak year of 1968. Catches then declined, and in 1992 Canada declared a moratorium. About 30,000 people lost their jobs. Even decades later, the stock has only partly recovered.
Fishing down the food web. In 1998, Daniel Pauly and colleagues showed that the average trophic level of the world's catches had fallen by about 0.1 per decade since 1950: as the big predatory fish became scarce, fleets turned to smaller, lower-level species. This is a sign of ecosystem-level change as well as a loss of individual stocks.
Not all stories are bleak. North Sea herring recovered after a closure in the late 1970s, the Pacific halibut and Alaska pollock have been managed for long-term yield, and well-regulated fisheries in New Zealand, Iceland and the United States have rebuilt many stocks.
The global picture
According to the Food and Agriculture Organization of the United Nations (FAO), the marine and inland capture of fish has been about 90 million tonnes per year since the late 1980s, and growth in the supply since then has come from aquaculture (fish farming), which now provides about half of the fish for human consumption. The FAO classifies stocks as overfished (biologically unsustainable) when they are being harvested beyond their sustainable level; this was about 35% of assessed stocks in 2019 and rose to about 38% in 2021. The majority of the rest are fully fished, with little room to grow. The percentages differ a lot between regions: well-assessed stocks in rich countries are doing better on average than the poorly monitored fisheries of many other regions.
Other problems add to overfishing. Bycatch kills turtles, seabirds, sharks and dolphins caught in nets and on hooks aimed at other species. Bottom trawling drags heavy gear over the seafloor, damaging habitats such as deep-sea corals. Illegal, unreported and unregulated (IUU) fishing is estimated by some studies to be a tenth or more of the global catch. Subsidies that reduce fishing costs can encourage fleets to grow beyond what the stocks can support.
Managing fisheries
- Catch limits (TACs). Scientists estimate the stock and set a yearly total, below MSY to be safe.
- Catch shares (ITQs). Each fisher receives a share of the TAC that can be traded. They are used in Iceland and New Zealand and give fishers a stake in the stock's health, but can concentrate ownership.
- Gear rules. Larger mesh sizes let small fish escape, and gear that avoids bycatch (turtle excluder devices) reduce collateral damage.
- Closed seasons and areas. Protecting spawning grounds and nurseries for part of the year.
- Marine protected areas (MPAs). In no-take reserves the fish are bigger and more numerous inside, and some "spill over" to the neighboring waters.
- Market tools. Certification schemes such as the Marine Stewardship Council label seafood from fisheries that meet sustainability standards.
All rely on good data, enforcement and the cooperation of fishers. Many ecologists now argue that managers should aim below MSY to leave a safety margin, and should consider the whole ecosystem, as predators, prey and habitat interact. Economists point out that the maximum economic yield occurs at a lower effort than MSY, because costs fall with fewer boats.
Common misconceptions
"Maximum sustainable yield is a safe target." It is the peak of the curve, so a small mistake in the stock estimate can push the fishery over the edge. Most managers treat it as a limit, not a goal.
"Fish catch is falling because fish are hard to catch." Where catches fall, it often reflects depleted stocks. Catch per unit effort can be misleading.
"Fish farming solves overfishing." It takes pressure off some wild stocks, but fed species such as salmon need fishmeal, and farms can pollute and spread disease.
"Bigger fleets catch more, so they are more productive." Above E_MSY, more effort yields less.
Try it
The first example computes the Schaefer model's equilibrium biomass and yield for different levels of fishing effort, with the numbers from the worked example.
Press Run (or Ctrl + Enter) to see the console output here.
No output.
The second example simulates the stock over 80 years for four levels of constant effort, starting from an unfished stock. The first panel shows the yield curve with the four efforts marked, and the second shows the biomass through time. The model is deterministic and simplified: real fisheries have variable recruitment, age structure and uncertainty.
Press Run (or Ctrl + Enter) to see the result here.
Program input · what you'd type while the program runs
Type the answers before you press Run, one per line. Each time the program reads a line (with input()), it gets the next line from this box.
Check your understanding
Quick check · 5 questions
of 5 answered You scored / 5 · perfect!
-
1. In the logistic model, at what biomass is the stock's growth fastest?
dB/dt = rB(1 − B/K) peaks at B = K/2, where it equals rK/4. -
2. With r = 0.4 per year and K = 1,000 kt, what is the MSY?
MSY = rK/4 = 0.4 × 1,000 / 4 = 100 kt per year. -
3. What happens to the equilibrium stock if effort exceeds r/q?
Removal exceeds even the maximum growth rate, so the equilibrium biomass is zero. -
4. Why can catch per unit effort stay high while a stock collapses?
Aggregation and better technology can hide the decline in total abundance. -
5. Which management tool gives fishers a tradable share of the total allowable catch?
ITQs allocate shares of a TAC that can be bought and sold.
Summary
- Fish populations follow roughly logistic growth; the Schaefer model gives
MSY = rK/4atE_MSY = r/(2q). - Effort beyond
E_MSYlowers yield, and effort beyondr/qdrives a stock to zero; warning signs come late. - Collapses such as Newfoundland cod (1992) and Peruvian anchoveta show the risks; some stocks have recovered after rebuilding.
- About 35% to 38% of assessed stocks are overfished, and aquaculture supplies about half of food fish.
- Management combines quotas, gear rules, closures, protected areas and market tools, ideally aiming below MSY.
Track your progress
Create a free account to tick off lessons and pick up where you left off on any device.
of Oceanography lessons completed