


















Lesson 45 of 49 · Projects and Practice
Case Study: The Collapse of the Northern Cod
Study the collapse of the Newfoundland northern cod in 1992: what happened, why the warning signs were missed, and a Python simulation comparing effort growth, a moratorium and a harvest rule.
In July 1992 the Canadian fisheries minister announced a two-year moratorium on fishing for northern cod, the stock that lived on the Grand Banks off Newfoundland and Labrador. For five centuries these fish had fed fishing villages and fleets from half of Europe. Some of the earliest accounts of the New World describe seas so full of cod that fish could be scooped up in baskets. Now the fish had all but vanished, and about 30,000 people lost their work in the largest industrial layoff in Canadian history. The two years became decades.
This case study asks why a stock that big failed and what the mathematics of chapter 7 can tell us. You will read what happened, simulate three different ways of managing a cod-like fishery and take away lessons that apply far beyond Newfoundland.
What you will learn
- The main events in the history of the northern cod, with hedged numbers
- Why the signs of collapse were missed: hyperstability, uncertain assessments and pressure to keep fishing
- How to simulate a fishery with effort growth, a moratorium and a harvest control rule
- What lessons the case has for managing other stocks
Key terms
Stock assessment: a scientific estimate of how many fish there are and how fast they are being removed.
Hyperstability: a catch rate that stays high while the stock shrinks, because fish gather in dense schools that are easy to find.
Harvest control rule: a pre-agreed formula that sets the catch from the estimated stock size.
Reference point: a target or limit value of biomass or fishing rate used to judge a stock.
Moratorium: a ban on fishing a stock.
What happened
Centuries of steady fishing. From the 1500s, fleets from Portugal, Spain, France and England came to the Grand Banks, and settlements grew along the coast of Newfoundland. Small boats fishing from shore with lines and traps took about 200,000 tonnes a year or so for generations, apparently without harm to the stock.
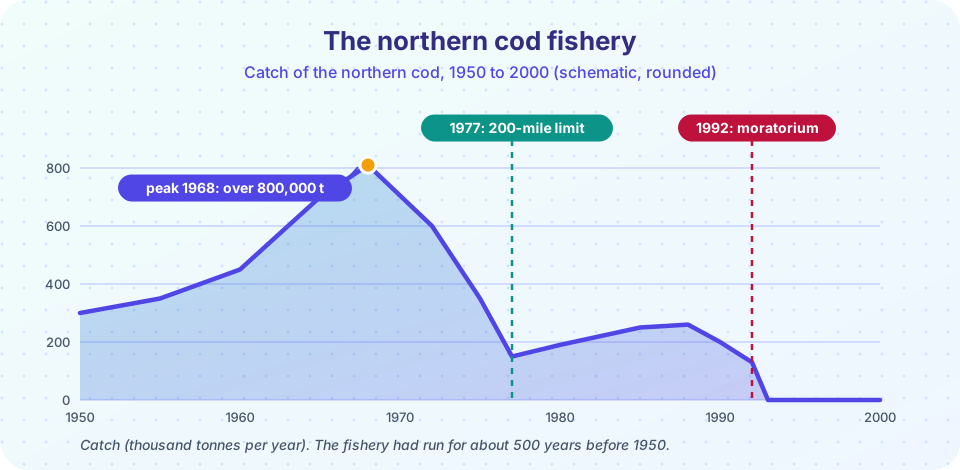
The factory trawler era. After the 1950s large, powerful stern trawlers from many countries began to fish the banks, towing huge nets day and night and freezing the catch on board. Annual catches rose to a peak of more than 800,000 tonnes in 1968, several times the long-term average. They then fell steeply as the stock declined.
Canada takes control. In 1977 Canada extended its jurisdiction to 200 nautical miles, expelling most of the foreign fleets. The fish started to recover somewhat, and Canada encouraged a large expansion of its own fleet and processing plants, assuming the stock would grow to support them. Catches in the 1980s were about 250,000 tonnes per year.
The signs that were missed. Several things hid the decline. Fishers' catch per hour stayed high because the fish concentrated in smaller areas (hyperstability). The stock assessments relied partly on that catch-rate data and overestimated the biomass, and the research surveys, which showed a decline from the mid-1980s, were doubted or taken as a temporary fluctuation. Meanwhile, there was strong social and political pressure to keep the fleets working. Environmental factors also played a part: cold water in the early 1990s, and changes in the populations of prey such as capelin and predators such as seals have been debated. Most analysts agree that overfishing was the main cause and that the environment made it worse.
Collapse. By 1992 the spawning biomass had dropped to a few percent of its earlier level. The moratorium began on 2 July 1992. The stock has remained low for decades and has recovered only in part, a pattern also seen in other cod stocks that fell to very low numbers. The social costs, in lost income and the decline of coastal communities, have been immense.
A model of the story
You can reproduce the pattern with the Schaefer model of chapter 7. The stock B follows
B(t+1) = B(t) + r B(t) (1 − B(t)/K) − C(t)
where the catch is C = q E B for fishing effort E. Take r = 0.3 per year and K = 3,000 thousand tonnes (illustrative values, not an official assessment of the real stock). The maximum sustainable yield is rK/4 = 225 kt/yr, reached at E_MSY = r/(2q). You will test three management stories, all starting from an unfished stock in 1950.
- Effort ratchet. Fishing effort grows 7% per year until 1992 (new boats, bigger nets, more fleets), when a moratorium sets the effort to zero.
- Harvest control rule. The catch is always 12% of the current stock, which is 80% of the rate that gives MSY (
F_MSY = r/2= 0.15). - Constant quota. A fixed quota of 180 kt/yr, below MSY, which is safe in the model but depends on knowing MSY.
Press Run (or Ctrl + Enter) to see the result here.
Program input · what you'd type while the program runs
Type the answers before you press Run, one per line. Each time the program reads a line (with input()), it gets the next line from this box.
When you run it, look at the story the lines tell. Under the effort ratchet the catch rises for decades, which looks like success, and peaks in the early 1980s. By then the stock is already falling, and by 1992 it has dropped to about a sixth of its unfished size. Even with fishing stopped, the model stock needs about three decades to regain its size. (The real northern cod recovered far less in the same time, which shows that this simple model leaves out important things: lost spawning groups, changed food webs, continued bycatch and slow growth.) The harvest control rule never produces a huge catch but never collapses, because the catch falls automatically when the stock does. The constant quota is safe here only because it is below the MSY; raise it above 225 kt and the stock eventually crashes, as the second example shows.
Why a constant catch is risky
The second example computes how long a stock lasts under a fixed quota. It shows how a quota that is just above the sustainable yield is not noticed for years, and then fails suddenly. This is the same arithmetic of surplus production that you used in chapter 7.
Press Run (or Ctrl + Enter) to see the console output here.
No output.
Lessons
- Catch is not abundance. Rising or high catches may mean the stock is being mined, and catch per unit effort can mislead (hyperstability). Independent surveys are essential.
- Uncertainty is a reason to be cautious. A model with
Korrwrong by 30% can turn a safe quota into a collapse. Harvest control rules that adjust the catch to the stock are more robust than fixed quotas. - Incentives shape science and policy. Large investments in boats and plants create pressure to keep fishing and to trust the optimistic estimate.
- Recovery can be slow. A depleted stock may be held down by changed ecosystems, loss of age structure and spawning grounds, and by continued bycatch.
- Collapses have human costs. They fall on communities as well as on fish, and good management serves both.
Common misconceptions
"The collapse happened because of cold water." Environmental changes probably contributed, but the main cause was removing far more fish than the stock could replace.
"Stopping fishing brings immediate recovery." Recovery depends on growth rates, spawning stock and ecosystem changes; it took decades or has not completed.
"A catch that was sustainable for 500 years was proof that it was safe." The traditional fishery used gear and effort that the stock could withstand; the industrial fleets did not.
Check your understanding
Quick check · 5 questions
of 5 answered You scored / 5 · perfect!
-
1. In what year did Canada impose the northern cod moratorium?
The moratorium started on 2 July 1992. -
2. What is hyperstability?
Fish aggregate and remain easy to find, so catch rates hide the decline. -
3. With r = 0.3 and K = 3,000 kt, what is the MSY?
MSY = rK/4 = 0.3 × 3,000 / 4 = 225 kt per year. -
4. Why is a harvest control rule more robust than a fixed quota?
A proportional rule reduces removals as the stock declines. -
5. Which is the best summary of the cause of the collapse?
Most analyses name overfishing as the main driver, with the environment as a contributor.
Summary
- The northern cod supported fisheries for centuries, peaked at more than 800,000 tonnes in 1968, and was closed in 1992 with about 30,000 job losses.
- Warning signs were hidden by hyperstability, optimistic assessments and pressure to keep fishing.
- A Schaefer-model simulation reproduces the rise-and-collapse shape of an effort ratchet and shows that a harvest control rule is more robust than a fixed quota.
- The main lessons are to use independent surveys, to build in caution for uncertainty and to plan for slow recovery.
Track your progress
Create a free account to tick off lessons and pick up where you left off on any device.
of Oceanography lessons completed