


















Lesson 39 of 49 · Observation and Modelling
Chapter 8 Overview: Observation and Modelling
Overview of how oceanographers measure and simulate the sea: ships, moorings, Argo floats, gliders, satellites, numerical models and data assimilation, with lesson links.
The ocean is hard to study. Light and radio waves do not travel far in water, so you cannot photograph the deep sea from a plane or find a current with radar. The ocean is huge: covering 361 million square kilometers and averaging 3.7 kilometers in depth. And it never stops changing, from waves lasting seconds to circulation changes lasting centuries. For most of history oceanographers could only lower an instrument from a ship and wait. It took a hundred years of exploration (chapter 1) to collect a modest map of the sea.
Today the picture is different. Thousands of robotic floats, a fleet of satellites, moorings and ships supply a nearly continuous stream of data. Computer models turn the data into forecasts and reconstructions. This chapter shows how the pieces fit: what each instrument measures, what its limits are and how models and observations are combined.
What you will learn
- The main platforms for ocean observation and what each can and cannot see
- Why observations and models are used together
- How coverage trades off against detail
- How the lessons in this chapter fit together
Key terms
In situ measurement: a measurement made in the water itself, as opposed to remote sensing.
Remote sensing: measuring from a distance, usually by satellite, using light, microwaves or radar.
Profile: a set of measurements at different depths at one place, such as temperature against depth.
Numerical model: a computer program that solves the equations of fluid motion and heat on a grid.
Data assimilation: combining observations with a model to produce the best estimate of the ocean's state.
The central trade-off
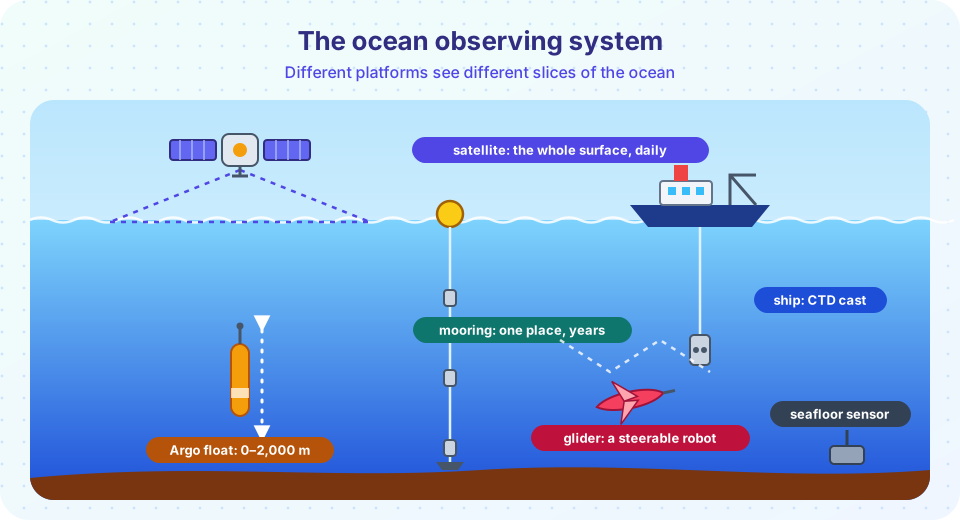
Every instrument gives something and loses something. A ship can lower a sophisticated sensor package to the seafloor and bring back water samples, but it measures one place at a time, and ship time costs tens of thousands of dollars a day. A satellite sees the entire surface every few days, but only the surface, and only certain quantities. A mooring records at one place continuously for years but says nothing about the neighbors. A float drifts and samples the interior, but on the schedule it follows.
No single platform covers every need, so the observing system combines them. The table sums up the typical strengths.
| Platform | Sees | Strength | Limit |
|---|---|---|---|
| Research ship | Full depth, at a point or along a line | Highest accuracy, water samples, many variables | Few, slow and expensive |
| Mooring | One place, surface to bottom | Continuous time series | Only one location |
| Argo float | Upper 2,000 m, everywhere | Global coverage, every 10 days | Coarse spacing, drifts |
| Glider and AUV | A chosen track | Steered, quiet, long missions | Slow (about 0.3 m/s) |
| Satellite | Surface only, everywhere | Global, frequent, long record | No view of the interior |
From data to understanding
Observations alone are a set of measurements, and they are patchy. A numerical model fills the gaps using the laws of physics, and observations keep the model honest. The two together can produce a map of the whole ocean, forecast tomorrow's currents, and test what would happen under different conditions, such as higher emissions. Chapter 8 follows that logic, as a chain from measuring to modeling to predicting.
Why measure?
In the water
From space
Models
What each lesson covers
| Lesson | Question it answers |
|---|---|
| Ships, Floats and Satellites | What does each instrument measure, and how well? |
| Models and Data | How do models work, and how are they tested and used? |
| Chapter 8 Review | Key numbers and a ten-question quiz. |
Common misconceptions
"Satellites see the whole ocean." They see the surface, a thin skin, and need in situ data for the interior.
"We have mapped the ocean floor." Satellite gravity gives low-resolution maps; only a fraction of the seafloor has been mapped at high resolution by ships.
"A model is just a guess." A model solves physical equations, and it is tested against data. Its limits are known and reported.
Try it
The first example does the arithmetic of the Argo float array: how many profiles it collects and how much ocean each float represents.
Press Run (or Ctrl + Enter) to see the console output here.
No output.
The second example plots where each platform sits on a chart of horizontal scale against the time between measurements. The numbers are round orders of magnitude for illustration, not exact specifications. The empty corner of the chart, fast and global and detailed, shows why we need several platforms.
Press Run (or Ctrl + Enter) to see the result here.
Program input · what you'd type while the program runs
Type the answers before you press Run, one per line. Each time the program reads a line (with input()), it gets the next line from this box.
Check your understanding
Quick check · 4 questions
of 4 answered You scored / 4 · perfect!
-
1. What does 'in situ' mean in oceanography?
In situ means on site: in the water, as with ships, moorings, floats and gliders. -
2. What is the main limit of satellite observations?
Light and microwaves do not penetrate the ocean far, so satellites measure the surface. -
3. About how many profiles per year do 4,000 floats collect at one profile per 10 days?
4,000 × 365 / 10 = 146,000. -
4. Why are models and observations used together?
This combination is called data assimilation.
Summary
- Water blocks light and radio waves, the ocean is huge and always changing, so observation needs several platforms.
- Ships give quality, moorings give time series, floats and gliders sample the interior and satellites see the whole surface.
- Models solve the physical equations and fill the gaps; observations test and correct them.
- The next lessons look at the instruments and at the models in detail.
Track your progress
Create a free account to tick off lessons and pick up where you left off on any device.
of Oceanography lessons completed