


















Lesson 38 of 49 · Human Impacts
Chapter 7 Review: Human Impacts
Review chapter 7: ocean warming, sea level (361 Gt per mm), acidification and pH, dead zones, plastics, biomagnification, MSY and fisheries management, with a ten-question quiz.
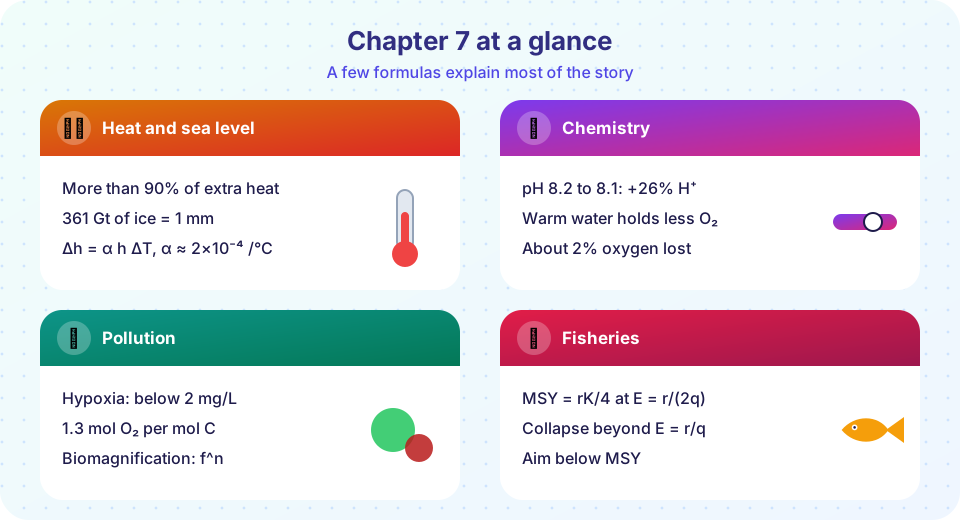
Chapter 7 turned the physics, chemistry and biology of the earlier chapters into a picture of change. The ocean's heat capacity explains why it absorbed most of the extra heat; the gas chemistry explains acidification; Redfield stoichiometry explains dead zones; and the logistic growth of fish stocks explains collapses. The most useful skill from this chapter is to estimate: a short calculation often tells you whether a claim is plausible.
What you will learn
- The key formulas and numbers of chapter 7
- How the pressures connect
- Which ideas to revisit before studying how the ocean is observed
Key terms
Sea level conversions: 361 Gt of ice melted is 1 mm of sea level; Δh = α h ΔT for thermal expansion.
pH: −log₁₀[H⁺]; a fall of 0.1 means 26% more hydrogen ions.
Oxygen demand: 1.3 mol O₂ per mol of organic carbon decomposed.
Biomagnification: C_n = C_water × f^n.
MSY: rK/4 at E = r/(2q) and B = K/2.
Recap table
| Lesson | Core idea | Formulas and numbers |
|---|---|---|
| Chapter 7 Overview | Six pressures act together; the ocean is a heat and carbon sink | More than 90% of extra heat; a quarter to a third of CO₂ |
| Warming, Sea Level and Acidification | Heat expands the water, melting adds mass, CO₂ lowers pH | About 20 cm since 1900; α about 2 × 10⁻⁴ /°C; pH 8.2 to 8.1; O₂ down about 2% |
| Pollution, Plastics and Dead Zones | Nutrients cause hypoxia; plastics persist; toxins magnify | Hypoxia below 2 mg/L; 5 to 13 Mt plastic per year (2010); 10⁴ at f = 10 over 4 steps |
| Fisheries and Overfishing | Effort above E_MSY lowers yield and can collapse stocks | dB/dt = rB(1 − B/K) − qEB; about 35% to 38% of stocks overfished |
How the pieces connect
The four lessons of this chapter share one thread: the ocean responds to what we add or remove according to the same physical and biological rules that govern it naturally. Heat capacity explains why the ocean stores the warming; thermal expansion and ice mass explain why that becomes sea level; the carbonate equilibrium explains why absorbed carbon dioxide lowers pH; Redfield stoichiometry and stratification explain why a bloom can suffocate the bottom; and the arithmetic of growth explains why fishing beyond a limit lowers the catch instead of raising it. When you meet a new claim about the ocean, ask which of these rules it rests on, and whether the numbers in the claim are of the right size. That habit, more than any single formula, is what the review is meant to build.
Common misconceptions
"The ocean absorbing CO₂ is purely good." It slows warming but causes acidification.
"Melting sea ice raises sea level." Land ice and thermal expansion do.
"Dead zones come from poison." They come from nutrient-driven oxygen loss.
"Fishing at MSY is the safe maximum." It is the peak, with no margin for error.
Try it
The first example is a drill that recomputes the chapter's key numbers.
Press Run (or Ctrl + Enter) to see the console output here.
No output.
The second example shows four measured changes together. They differ by orders of magnitude, so the bars use a signed logarithmic scale; the values are rounded and the plot shows only direction and rough size, not importance.
Press Run (or Ctrl + Enter) to see the result here.
Program input · what you'd type while the program runs
Type the answers before you press Run, one per line. Each time the program reads a line (with input()), it gets the next line from this box.
Check your understanding
Quick check · 10 questions
of 10 answered You scored / 10 · perfect!
-
1. How many gigatonnes of melted ice raise the ocean by 1 mm?
3.61 × 10¹⁴ m² × 0.001 m × 1,000 kg/m³ = 3.61 × 10¹⁴ kg = 361 Gt. -
2. A 700 m layer warms by 0.3 °C with α = 2 × 10⁻⁴ per °C. The thermal expansion is about...
Δh = 2 × 10⁻⁴ × 700 × 0.3 = 0.042 m. -
3. A fall in pH from 8.1 to 7.8 multiplies [H⁺] by about...
10^0.3 ≈ 2. -
4. What makes a bloom's decomposition create a dead zone?
Decomposition consumes about 1.3 mol O₂ per mol C, and stratification blocks resupply. -
5. A pollutant multiplied by 5 at each of three trophic steps is how much more concentrated at the top?
5³ = 125. -
6. At what effort is the sustainable yield maximized in the Schaefer model?
The parabola Y = qEK(1 − qE/r) peaks at E = r/(2q). -
7. Which describes a Great Pacific Garbage Patch correctly?
It is a dilute scatter, concentrated by the convergent currents of the subtropical gyre. -
8. Roughly what fraction of assessed fish stocks was classified as overfished by the FAO around 2019 to 2021?
35% in 2019 and about 38% in 2021. -
9. Why does warming reduce dissolved oxygen?
Solubility falls with temperature, and a stronger stratification slows ventilation of the interior. -
10. Why is MSY a risky target?
Stock estimates are uncertain; managers usually aim below MSY.
Summary
- The ocean has absorbed more than 90% of the extra heat and a quarter to a third of the emitted CO₂, with consequences for sea level, pH and oxygen.
- Nutrients, plastics, oil and persistent chemicals reach the sea mostly from land; dead zones come from oxygen loss, and toxins magnify up food chains.
- Fisheries follow growth mathematics: MSY is a peak, not a safe target; management must combine limits, gear rules, protected areas and enforcement.
- To manage any of these requires measurement, which is the subject of chapter 8.
Track your progress
Create a free account to tick off lessons and pick up where you left off on any device.
of Oceanography lessons completed