


















Lesson 49 of 49 · Projects and Practice
Further Study
Plan your next steps after this oceanography course: the four branches of the science, skills to build, open data sets to explore, books, careers and related tracks on this site.
You have reached the end of the course, but oceanography is only beginning. The questions that attract researchers now are open ones: how fast will the overturning circulation change, what lives in the twilight zone and how much carbon it moves, how reefs might adapt, and how to feed a growing population without emptying the sea. Each of them needs the foundations you now have and some more.
This lesson maps the next steps. It describes the four branches of the science, the skills worth building, where to find real data, what to read and how this course connects to other tracks on the site.
What you will learn
- The four traditional branches of oceanography and what each asks
- Which skills to build for each path
- Where real ocean data can be found and how to start analyzing it
- Which other tracks on this site continue your learning
Key terms
Physical oceanography: the study of currents, waves, tides, heat and the physics of the ocean.
Chemical oceanography: the study of the composition of sea water, its cycles and its carbon chemistry.
Biological oceanography: the study of marine life and its interactions with the environment.
Geological oceanography: the study of the seafloor, its sediments and its history.
Interdisciplinary: combining several fields, as most modern ocean research does.
Four branches, one ocean
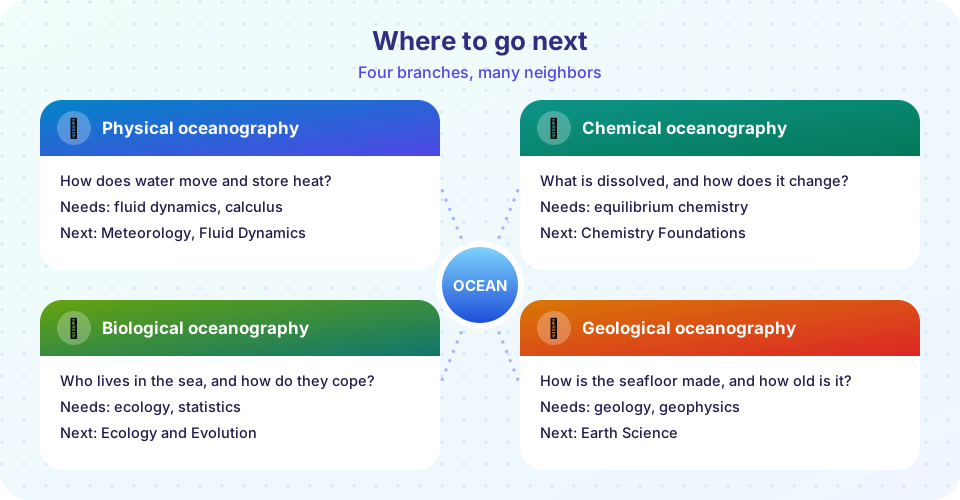
- Physical oceanography asks how water moves and stores heat. It needs fluid dynamics, mathematics and statistics, and it connects to meteorology and climate science. Typical questions: what drives the Gulf Stream, how do eddies carry heat, how will the overturning change?
- Chemical oceanography asks what is dissolved in sea water and how it changes. It needs chemistry, especially equilibrium and acid-base chemistry. Typical questions: how fast is the ocean taking up carbon, why does oxygen fall, where does iron come from?
- Biological oceanography asks what lives in the sea and how it responds. It needs ecology, evolution and statistics. Typical questions: how do plankton communities shift with warming, how do fish stocks respond to fishing and climate, how does life survive at 5,000 meters?
- Geological oceanography asks about the seafloor and its history. It needs geology and geophysics. Typical questions: how does new crust form at ridges, what do sediment cores say about ancient climates, where do earthquakes and tsunamis begin?
In practice, the boundaries blur. A project on the biological pump needs physics (how fast the water sinks), chemistry (how carbon dissolves) and biology (who eats the particles). Interdisciplinary teams are the norm.
Skills to build
- Mathematics. Calculus and differential equations for dynamics; linear algebra for models and data; statistics and probability for uncertainty. The course gave you the physical ideas; the mathematics lets you take them further.
- Programming and data analysis. Python is the common language: arrays, plotting, statistics and data files. The code cells in this course are a start.
- Measurement and uncertainty. Understand calibration, error bars, bias and sampling; most of the difficulty in observational oceanography lies here.
- Communication. Explaining a result to a non-specialist is as important as computing it. Practice by writing a one-page summary of any project.
- Field experience. If you can, join a research cruise, a coastal monitoring group or a citizen science project such as beach surveys or plankton counts.
Real data to explore
Open ocean data are among the most accessible in science. These are good starting points (search for the names):
- Argo data centers: profiles of temperature and salinity from the float array.
- NOAA (the U.S. National Oceanic and Atmospheric Administration): sea surface temperature, ENSO indices, Coral Reef Watch bleaching alerts, tide gauge records and the World Ocean Atlas.
- Copernicus Marine Service (European Union): ocean forecasts, reanalyses and satellite products.
- NASA ocean color and altimetry archives: chlorophyll and sea level maps.
- GEBCO (General Bathymetric Chart of the Oceans): seafloor depth grids.
- Global Carbon Project: carbon budgets with the ocean's uptake.
A good first project is to download a tide gauge record or a sea surface temperature series for a place you know, plot it, remove the seasonal cycle and fit a trend, as in the example below.
Books and ideas
- The Sea Around Us by Rachel Carson (1951) is a classic of science writing about the ocean.
- Descriptive Physical Oceanography by Talley, Pickard, Emery and Swift, and Introductory Dynamical Oceanography by Pond and Pickard, are standard university texts for the physical branch.
- The scientific assessments by the IPCC (the ocean and cryosphere report and the sixth assessment report) summarize the state of knowledge about the ocean and climate.
- The reports of the FAO on the state of world fisheries and aquaculture give the data on fishing.
Where to go on this site
| If you liked... | Continue with |
|---|---|
| The atmosphere, winds and storms | Meteorology and Climate Science |
| The seafloor and plate tectonics | Earth Science |
| Ecosystems, fisheries and pollution | Biology: Ecology and Evolution and Environmental Science |
| Waves, currents and flows | Fluid Dynamics and Waves and Optics |
| Models and simulations | Computational Physics and Mathematical Modelling |
| Data, uncertainty and trends | Statistics and Probability, Python, NumPy and pandas |
| Seawater chemistry | Chemistry Foundations |
Careers
Oceanographers work at universities and research institutes, at national agencies for weather and oceans, in the offshore energy and shipping industries, in fisheries management, in environmental consulting, in marine conservation and in policy and law. Many do not carry the title "oceanographer": they are data scientists, engineers, biologists and chemists who work on the sea.
Common misconceptions
"You must live by the coast to study the ocean." Much of the work is done with data and models, from anywhere.
"Oceanography is only for biologists." Physics, chemistry, mathematics, geology, engineering and computing all matter.
"The ocean has been fully explored." Most of the seafloor has not been mapped at high resolution, and most deep-sea species are unknown.
Try it
The first example is a path finder. It maps interests to the branches of oceanography and to the next track to try. Change the list of interests to see the suggestions.
Press Run (or Ctrl + Enter) to see the console output here.
No output.
The second example is your first piece of data analysis: fitting a trend and a seasonal cycle to a monthly series by least squares. The series is synthetic: a trend of 3.3 mm per year, an annual cycle and noise, so you can check that the method finds the numbers that were put in. With real data, the same steps give real trends.
Press Run (or Ctrl + Enter) to see the result here.
Program input · what you'd type while the program runs
Type the answers before you press Run, one per line. Each time the program reads a line (with input()), it gets the next line from this box.
Check your understanding
Quick check · 4 questions
of 4 answered You scored / 4 · perfect!
-
1. Which branch of oceanography studies the composition and cycles of sea water?
Chemical oceanography covers dissolved substances, carbon chemistry and nutrient cycles. -
2. What is a good first data project?
It uses real data, simple tools and teaches about seasonality and error. -
3. Which skill is common to almost every branch?
Modern oceanography is data-intensive across all branches. -
4. Why is autocorrelation important when fitting a trend?
Correlated noise reduces the effective number of independent points.
Summary
- Oceanography has four branches (physical, chemical, biological, geological), and most research combines them.
- Useful skills are mathematics, programming, an understanding of uncertainty and good communication.
- Open data from Argo, NOAA, Copernicus, NASA and GEBCO let you start real analysis at once.
- Related tracks on this site continue the path: meteorology, climate science, earth science, ecology, fluid dynamics, modelling, statistics and Python.
Track your progress
Create a free account to tick off lessons and pick up where you left off on any device.
of Oceanography lessons completed