


















Lesson 44 of 49 · Projects and Practice
Project: a 36-month financial model
Build a simple 36-month model for a subscription app: customers, revenue, cost, cash and break-even, then test sensitivity to decide how much funding to raise.
In this project you will build the kind of model that sits behind every sensible startup plan. It is small enough to understand completely, and it answers a real question: how much money does this business need before it pays for itself, and how long will that take? You will write the assumptions, compute the customers, revenue, costs and cash month by month, find the break-even month, and test which assumptions matter most.
The company is an invented one: a subscription app for freelancers that sends invoices and chases late payers. Every number is an example, so treat the project as a template and replace the assumptions with ones from your own idea.
What you will learn
- How to turn a business idea into a table of assumptions
- How to model customers with new sign-ups and churn
- How to compute revenue, cost, profit and cash by month
- How to find break-even and the funding the business needs
- How to test sensitivity and write down a decision
Key terms
Steady state: the level at which customers added each month equal customers lost, so the total stops changing.
Funding need: the deepest point of cumulative losses, which is the cash the company must have to survive until break-even.
Tornado chart: a bar chart that ranks inputs by how strongly each changes the result.
Burn: net cash spent per month when revenue is below cost.
Sensitivity: how much the result moves when one assumption changes.
Step 1: the question and the assumptions
Question: How much funding does the app need to reach monthly break-even, and when does that happen?
Assumptions. Write them in one place, with a note about where each comes from.
| Assumption | Value | Where it came from (example) |
|---|---|---|
| Price per customer per month | $20 | Competitor prices range from $12 to $29 |
| Variable cost per customer | $8 | Payment fees, hosting, support time |
| Starting customers | 100 | Waiting list and first pilot users |
| New customers per month | 60 | Planned budget divided by expected CAC |
| Acquisition cost (CAC) | $80 | Small channel tests |
| Monthly churn | 4% | Guess; to be measured from cohorts |
| Fixed costs per month | $6,000 | Two part-time salaries, tools, accounting |
Notice that churn is flagged as a guess. It is the hardest assumption to know early, and it sets the ceiling on how large the business can grow, so it deserves the first real measurement.
Step 2: customers
Each month a share of customers leave, and new ones arrive:
customers next month = customers × (1 − churn) + new customers
With 100 customers, 4% churn and 60 new customers, next month has 100 × 0.96 + 60 = 156. The number keeps climbing but more and more slowly, because the share lost (4% of a bigger base) approaches the 60 added. It levels off where churn × customers = new customers:
steady state = new customers ÷ churn = 60 ÷ 0.04 = 1,500
So the plan never exceeds 1,500 customers unless you raise acquisition or reduce churn. That ceiling is itself a useful insight.
Step 3: revenue, cost and profit
- Revenue = customers × price.
- Total cost = fixed costs + customers × variable cost + new customers × CAC.
- Profit = revenue − total cost.
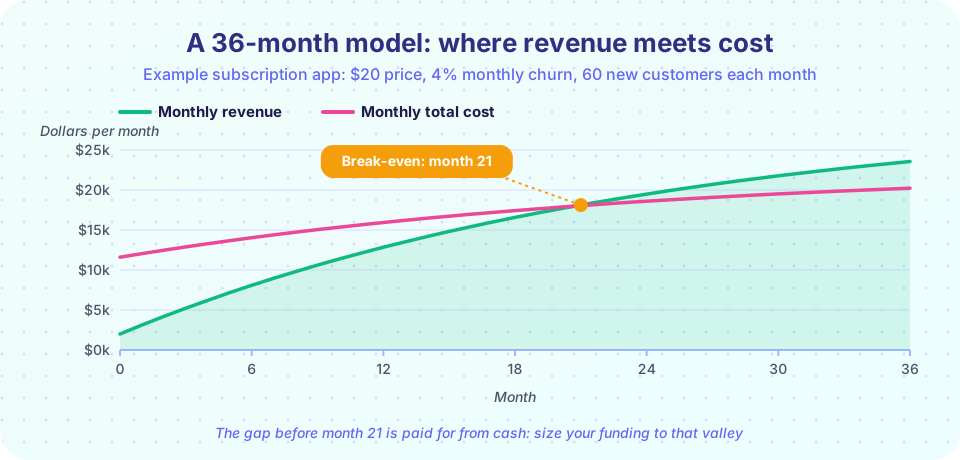
At 100 customers, revenue is $2,000 and total cost is 6,000 + 800 + 4,800 = 11,600, a loss of $9,600. Each customer contributes 20 − 8 = 12 a month, so the business covers its monthly fixed and acquisition costs of $10,800 when customers × 12 = 10,800, i.e. at 900 customers. Starting at 100 and growing toward 1,500, the model crosses 900 at around month 21.
Step 4: cash and funding need
Cash is what the company actually holds. Starting cash plus each month's profit gives the running balance. (We ignore payment delays and taxes to keep the model simple; the cash-flow lesson showed how to add them.) The funding need is the lowest point of cumulative profit: the company must hold at least that much, plus a safety margin, to survive until it breaks even.
Press Run (or Ctrl + Enter) to see the result here.
Program input · what you'd type while the program runs
Type the answers before you press Run, one per line. Each time the program reads a line (with input()), it gets the next line from this box.
Run it and read the printout. The model says break-even arrives in month 21 and the company needs roughly $81,000 of cash to get there (the lowest cumulative profit). In practice you would add a margin for error of at least 25% to 50%, because your assumptions are wrong in some direction, and a cushion of six months of operating costs in case growth is slower.
Step 5: sensitivity
Which assumption would hurt most if you were wrong? A tornado chart answers by changing each input by 20% up and down and recording the effect on the result you care about, here the funding need. Inputs at the top of the chart deserve the most research.
Press Run (or Ctrl + Enter) to see the result here.
Program input · what you'd type while the program runs
Type the answers before you press Run, one per line. Each time the program reads a line (with input()), it gets the next line from this box.
Look at the ranking. In this run price dominates by a wide margin: a 20% lower price raises the funding need by more than $90,000, while a 20% higher price cuts it by about $31,000. Fixed costs, acquisition cost and variable cost come next, and the starting customer count matters little. Churn moves the funding need less than you might expect, because over 36 months the customer count is still climbing; its larger effect is on the ceiling of 1,500 customers. That tells you where to spend research time: test prices, keep fixed costs low until revenue arrives, and measure real churn from the first cohorts.
Step 6: write the decision
A model is not finished until you can say what it means. For this example, a good write-up might read:
With the assumptions above, the app breaks even in month 21 and needs about $81,000 at its lowest point. We will raise $120,000 to cover the gap with a 50% cushion. The biggest risks are price and fixed costs. Before raising, we will run a pilot to measure churn over three months and test a $24 price on new sign-ups. If real churn is far above 4%, the ceiling falls (at 6% it is only 1,000 customers) and we will fix retention before spending on growth.
Notice the shape: the number, the buffer, the biggest risks, the next experiment and a condition that would change the plan. Investors and teammates both respond better to this than to a spreadsheet with no story.
Extending the model
Once the basic model works, add features one at a time and keep only those that change a decision.
- Annual plans. Customers paying a year up front improve cash at the start. Model the share who choose annual.
- Payment delays. Add a month of lag for some revenue.
- Price tiers. Replace one price with two or three plans.
- Seasonality. Monthly new-customer counts that rise and fall through the year.
- Hiring. Step increases in fixed costs when the customer count passes thresholds.
- Scenarios. Pessimistic, expected and optimistic cases for churn and new customers.
Common misconceptions
"The model tells us the future." It tells you the consequences of your assumptions. If the assumptions are wrong, so are the results; that is why you test sensitivity.
"Break-even means we are safe." The business may still be fragile if churn rises or a key channel dries up. Keep a cash buffer after break-even.
"More detail is better." Each extra row is another guess. Keep the model as simple as the decision allows.
Check your understanding
Quick check · 5 questions
of 5 answered You scored / 5 · perfect!
-
1. With 4% monthly churn and 80 new customers a month, what is the steady-state number of customers?
Steady state = new customers / churn = 80 / 0.04 = 2,000. -
2. Price is $25 and variable cost is $10. Fixed and acquisition costs total $9,000 a month. How many customers are needed to break even?
Contribution per customer = 15. Customers needed = 9,000 / 15 = 600. -
3. What is the funding need in a model like this?
The deepest cumulative loss is the cash required to survive until break-even. -
4. Why test sensitivity?
Sensitivity shows which inputs carry the most risk. -
5. Why add a cushion to the calculated funding need?
A buffer protects against slower growth, higher churn or delays.
Summary
- Start with a question and a table of assumptions with sources.
- Customers next month = customers x (1 - churn) + new customers; the steady state is new customers divided by churn.
- Profit = revenue - (fixed costs + variable costs + acquisition cost); break-even customers = (fixed + acquisition) / margin.
- Funding need is the deepest cumulative loss; add a cushion.
- Use a tornado chart to rank assumptions, then write the decision and the next experiment.
Next: A pitch deck
Track your progress
Create a free account to tick off lessons and pick up where you left off on any device.
of Entrepreneurship lessons completed