


















Lesson 14 of 49 · Finding and Validating Ideas
Market sizing
Learn to estimate how big a market is with top-down and bottom-up methods, the TAM, SAM and SOM layers, and simple Fermi estimates you can check yourself.
Suppose your interviews show that a real group has a real problem. A new question arrives: are there enough of them to support a venture? A problem that affects a hundred people, each able to pay five dollars a year, will not feed a company. A problem that affects millions may. Estimating the size of a market is the skill of answering this question roughly, quickly and honestly.
Market sizing is not about precision. Nobody can know the exact number of future customers. The aim is to find the order of magnitude (hundreds, thousands, millions) and, more importantly, to understand which assumptions the result depends on. This lesson teaches the vocabulary of TAM, SAM and SOM, the difference between top-down and bottom-up estimates and the Fermi method of breaking a big unknown into small guessable parts.
What you will learn
- What TAM, SAM and SOM mean and how they nest.
- How top-down and bottom-up estimates differ and why bottom-up is more believable.
- How to do a Fermi estimate and check it.
- How to use sensitivity checks to see which assumption matters most.
Key terms
TAM (total addressable market): the total yearly revenue available if every possible customer bought your type of product.
SAM (serviceable available market): the part of the TAM you can serve given your product, location and channels.
SOM (serviceable obtainable market): the part of the SAM you can realistically win in a given period.
Top-down estimate: starting from a big published figure and taking a percentage.
Bottom-up estimate: counting actual customers and multiplying by price.
TAM, SAM and SOM
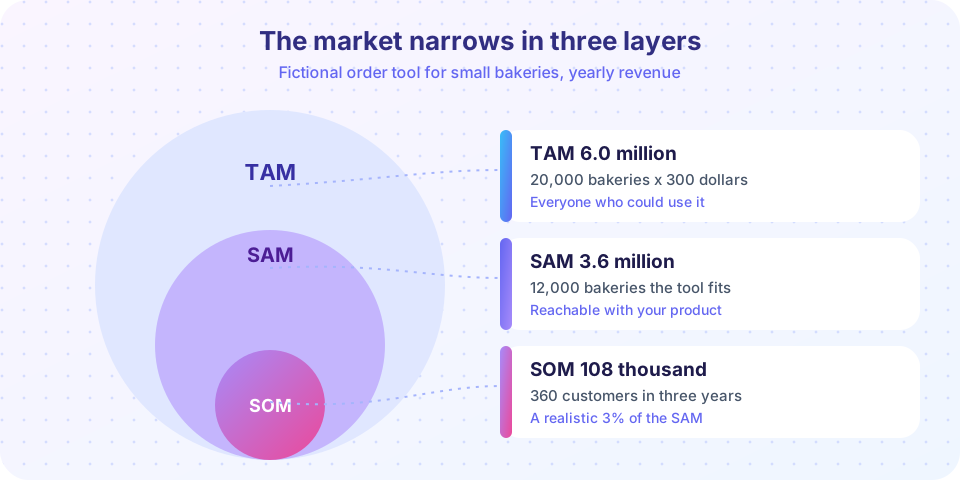
Picture three circles inside one another. The TAM is the largest: if every person or business who could possibly use your kind of product did so, how much would they spend each year? The SAM is the portion you can reach with your product and your way of selling: perhaps only your country, only small businesses, or only people with the right equipment. The SOM is what you can realistically capture in the next few years, given your resources, competitors and marketing.
Example. A fictional company sells an online tool for small bakeries to manage orders. In its country there are 20,000 bakeries (potential customers). A subscription costs 300 dollars a year. TAM = 20,000 x 300 = 6 million dollars a year. Only bakeries with fewer than ten staff and with internet access fit the product: 12,000 bakeries, so SAM = 12,000 x 300 = 3.6 million dollars. With a small team, the company expects to reach 3 percent of those bakeries in three years: 360 customers, so SOM = 360 x 300 = 108,000 dollars a year.
The SOM is the number that matters for planning. A venture that needs 500,000 dollars a year to survive cannot live on this SOM, and that is valuable to discover early.
Top-down versus bottom-up
A top-down estimate starts with a large published number: "The global pet-care market is worth X billion dollars; if we capture 1 percent, we get Y." It is quick, but it is also the weakest kind of argument. Taking a percentage of a huge figure sounds reasonable but says nothing about how you will reach those customers. Investors tend to distrust "if we only capture 1 percent" reasoning.
A bottom-up estimate builds from the ground: how many customers can I reach through each channel, what fraction will buy, and what will each pay? For example: "I can visit 40 bakeries a month; 10 percent will subscribe; each pays 300 dollars a year." This is slower but much more credible, because each step is an action you can test and improve.
Use both: top-down to check that the market is not tiny, and bottom-up to see whether your plan reaches enough customers.
Fermi estimates
The physicist Enrico Fermi was famous for rough calculations in which a big unknown is split into smaller quantities that can each be guessed. The classic example asks how many piano tuners work in a large city. You guess the population, the share of households with pianos, how often a piano is tuned, how many pianos a tuner can service in a day and how many days a tuner works. Multiplying gives a plausible number, usually within a factor of two or three, even though each guess was rough, because over- and under-estimates tend to cancel.
Apply the same approach to a venture. Suppose you want to sell reusable lunch containers to office workers in one city. Estimate: city population (say 1,000,000), share who are office workers (say 25 percent = 250,000), share who bring lunch at least twice a week (say 30 percent = 75,000), share who might buy a container each year (say 10 percent = 7,500) and price (say 20 dollars). Revenue: 7,500 x 20 = 150,000 dollars a year for the city. Each assumption is visible, so you can check it with a quick survey or public statistics.
Sensitivity: which assumption matters?
After a Fermi estimate, change each assumption by plus or minus 50 percent and see how the result moves. If halving the share who bring lunch halves the answer but halving the price has the same effect, both matter equally; if one assumption can change the result tenfold, you must investigate it first. This simple exercise turns a guess into a research plan.
Is the market big enough?
"Big enough" depends on the venture type. A lifestyle business needs a market that supports one person's income. A scalable startup needs a market large enough for tens or hundreds of millions in revenue, which is why investors ask about TAM. A social enterprise needs a market of beneficiaries and payers. When your SOM is too small, you have three options: widen the segment, raise the price or choose a different problem. Doing this arithmetic before building prevents painful surprises.
Common misconceptions
"I only need 1 percent of a huge market." This is wishful thinking unless you can show how you will reach and convert those customers. Capture is earned through channels and product quality.
"A bigger TAM always means a better idea." A huge market with strong competitors and high costs of reaching customers may be worse than a small niche you can dominate.
"Market size is a fixed fact." Markets change as technology, prices and habits change. Treat your estimate as a hypothesis to update.
Try it
The first tool computes TAM, SAM and SOM from inputs. Change the numbers to match your own venture, and see whether the SOM covers the revenue you need.
Press Run (or Ctrl + Enter) to see the result here.
Program input · what you'd type while the program runs
Type the answers before you press Run, one per line. Each time the program reads a line (with input()), it gets the next line from this box.
The second tool runs a sensitivity check on the lunch-container Fermi estimate. It halves and doubles each assumption in turn and draws a bar for how far the final answer moves.
Press Run (or Ctrl + Enter) to see the result here.
Program input · what you'd type while the program runs
Type the answers before you press Run, one per line. Each time the program reads a line (with input()), it gets the next line from this box.
Check your understanding
Quick check · 5 questions
of 5 answered You scored / 5 · perfect!
-
1. Which statement correctly orders the three market layers from largest to smallest?
The TAM contains the SAM, which contains the SOM. -
2. Why is a bottom-up estimate usually more convincing than a top-down one?
Bottom-up estimates show how customers will be reached and converted, not just a share of a big figure. -
3. 20,000 potential customers pay 300 dollars a year. What is the TAM?
20,000 x 300 = 6,000,000 dollars per year. -
4. What is the purpose of a Fermi estimate?
Fermi estimates give an order of magnitude and reveal the assumptions that matter. -
5. Why do a sensitivity check on your estimate?
Sensitivity shows where research effort has the most value.
Summary
- TAM, SAM and SOM nest: everyone possible, those you can serve, those you can realistically win.
- Bottom-up estimates, built from channels and conversion, are more credible than top-down percentages.
- Fermi estimates break a large unknown into small guesses that can be checked.
- Sensitivity checks show which assumption to research first.
- If the SOM is too small, widen the segment, raise prices or change the problem.
Next: Testing with an MVP
Track your progress
Create a free account to tick off lessons and pick up where you left off on any device.
of Entrepreneurship lessons completed