


















Lesson 39 of 49 · Growth, Ethics and Exit
Scaling and metrics
Learn compound growth and the rule of 72, track AARRR metrics, read retention cohorts, avoid vanity numbers and scale a company without breaking what works.
Everyone wants growth, but few can say what good growth looks like. Is 20% more customers in a quarter impressive or poor? Is a surge of visitors after a news mention a sign of success or a distraction? Without clear numbers, founders celebrate the wrong things and miss the early warnings of trouble.
This lesson gives you three tools. The first is the arithmetic of compound growth, which tells you how fast a given rate really is. The second is a small set of metrics that separate healthy growth from noise. The third is a practical guide to scaling: growing the company without breaking the things that made it work.
What you will learn
- How to compute compound growth and doubling time
- What healthy weekly growth looks like for a young company
- The five AARRR metrics and how to read a retention curve
- Which numbers mislead (vanity metrics) and which guide decisions
- What tends to break during scaling and how to prepare
Key terms
Compound growth rate: the percentage by which a quantity grows each period, applied to the new total each time.
Cohort: a group of customers who started in the same period, tracked together over time.
Retention curve: a chart of what share of a cohort is still active after each period.
Viral coefficient: the average number of new users each existing user brings in.
Vanity metric: a number that looks impressive but does not help you make decisions, such as total sign-ups ever.
Compound growth
If a quantity starts at N0 and grows by a fixed rate g each period, after t periods it equals:
N(t) = N0 × (1 + g)^t
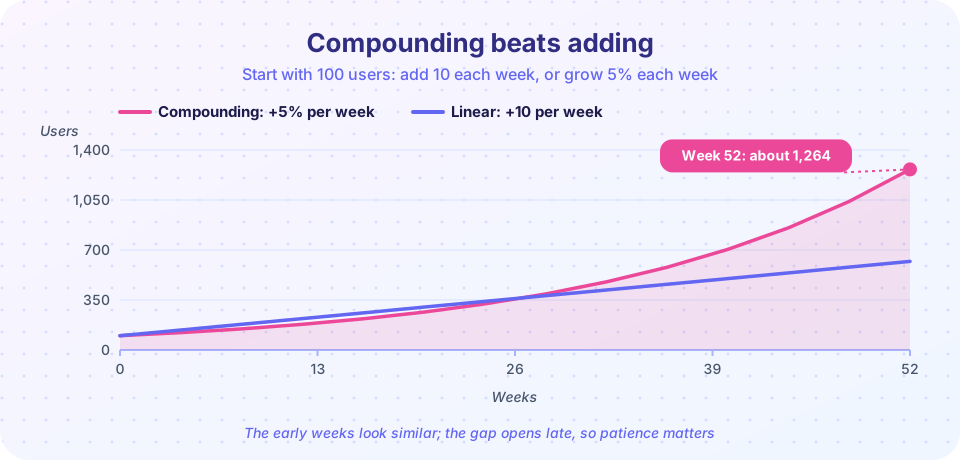
Start with 100 users and grow 5% per week. After 52 weeks: 100 × 1.05^52 ≈ 1,264. Growth of 10 users a week (linear) gives 100 + 10 × 52 = 620. The compound path ends twice as high.
A handy shortcut is the rule of 72: the time it takes to double is roughly 72 ÷ rate in percent. At 5% per week, doubling takes about 72 ÷ 5 = 14.4 weeks (the exact figure is ln 2 ÷ ln 1.05 ≈ 14.2). At 10% per week, doubling takes about 7 weeks. At 2% per month, about 36 months.
Paul Graham, a co-founder of Y Combinator, wrote in his 2012 essay "Startup = Growth" that a good weekly growth rate for a young startup is around 5 to 7%, and that 10% a week is exceptional. Treat these as a rough guide: they apply to early-stage products where the base is small. As a company grows, the same percentage becomes harder to sustain, and growth rates normally slow. A company that grows 100% a year is doing very well at a large size.
Press Run (or Ctrl + Enter) to see the result here.
Program input · what you'd type while the program runs
Type the answers before you press Run, one per line. Each time the program reads a line (with input()), it gets the next line from this box.
Notice how close the rule of 72 is at all four rates. It is a mental shortcut, accurate to within a few percent for rates like these, but not an exact formula.
The five AARRR metrics
Investor Dave McClure introduced the "pirate metrics" framework in 2007: the five stages every customer relationship passes through, abbreviated AARRR.
| Stage | Question | Example measurement |
|---|---|---|
| Acquisition | How do people find us? | Visitors per channel, cost per visitor |
| Activation | Do they have a good first experience? | Share who complete the first key action |
| Retention | Do they come back? | Share of a cohort active in week 4 |
| Revenue | Do they pay? | Conversion to paid, average revenue per user |
| Referral | Do they tell others? | Invites sent, viral coefficient |
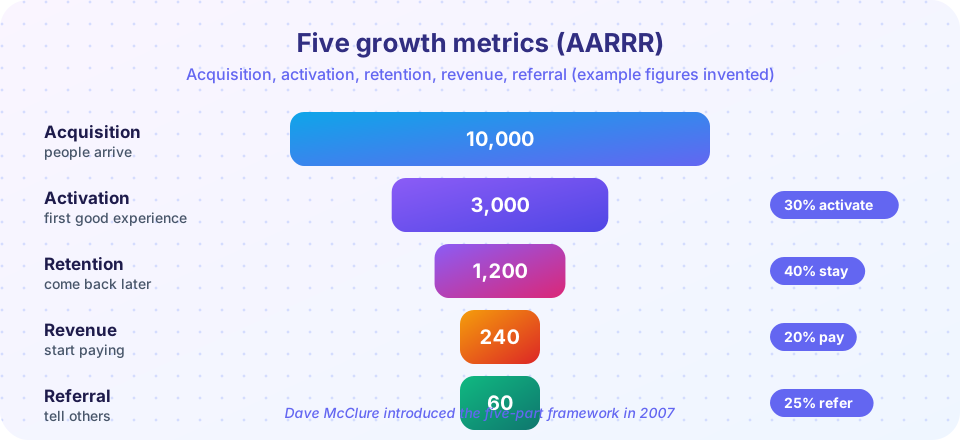
Use it as a checklist: for each stage, name one number, record it weekly, and see which stage is weakest. Many consumer products discover that acquisition is fine but activation is poor: visitors sign up and never do the one thing that makes the product valuable. Fixing that step is cheaper than buying more visitors.
Retention: the foundation
If customers do not stay, no amount of acquisition produces lasting growth. A cohort table groups customers by the week or month they joined and shows what share remain active in each following period. Plotting that share gives a retention curve. Two shapes matter:
- A curve that keeps falling toward zero signals a product people try and abandon. Growth requires continuously replacing the lost users.
- A curve that flattens at some level, say 25% still active after six months and staying there, signals a core group who find lasting value. That flat part is a sign you may have something customers need.
Marc Andreessen popularized the term product-market fit for the moment when a product satisfies a strong market demand. A widely used survey test from entrepreneur Sean Ellis asks users how they would feel if they could no longer use the product; if at least about 40% say "very disappointed", that is often taken as a sign of fit. It is a heuristic, not a law, but it is a useful sanity check next to retention data.
Press Run (or Ctrl + Enter) to see the result here.
Program input · what you'd type while the program runs
Type the answers before you press Run, one per line. Each time the program reads a line (with input()), it gets the next line from this box.
Product A loses 15% of its remaining users every week, so by week 12 only about 14% remain and the curve still heads for zero. Product B levels off near 30%. B is the product you can build a business on, even if its early drop-off looks steeper.
Growth loops and virality
Some growth comes from outside the product (ads, press), and some from the product itself. A viral coefficient k is the average number of new users each existing user brings in. If every user invites 4 people and 20% of invitees join, then k = 4 × 0.20 = 0.8. A k above 1 means each user brings more than one new user, so growth feeds itself; below 1 the effect fades after a few rounds but still reduces your acquisition cost.
Press Run (or Ctrl + Enter) to see the console output here.
No output.
Real viral loops are rarely this clean: invitations arrive with delays, and conversion drops as the friends you can reach become less interested. Still, estimating k tells you whether sharing is a growth engine or a nice extra.
Vanity versus actionable metrics
Eric Ries, in The Lean Startup (2011), contrasted vanity metrics with actionable metrics. Total registered users ever, page views and social media followers go up and to the right whatever you do, so they cannot tell you if a decision worked. Actionable metrics tie to specific behavior and can be tested: the share of a new weekly cohort that completes onboarding, the conversion of trial to paid, week-4 retention of this month's cohort.
If you are unsure whether a number is vanity, ask: "If this number changed, what would I do differently?" If the answer is "nothing", stop reporting it.
For subscription businesses, track monthly recurring revenue (MRR) and its parts: new MRR, expansion (customers upgrading), contraction (downgrades) and churned MRR. Net revenue retention is (starting MRR + expansion − contraction − churn) ÷ starting MRR; a value above 100% means existing customers alone are growing the business.
Scaling without breaking
Scaling means increasing output faster than costs. It is tempting to treat it as "more of everything", but several things break first.
- Communication. In a team of 5 everyone knows everything; at 25 information gets lost. Write down decisions, hold regular, short meetings, and make it clear who decides what.
- Quality. Work that was lovingly handcrafted for 50 customers becomes inconsistent at 5,000. Define quality standards and check them; automate stable steps.
- Processes and systems. Spreadsheets that worked for a hundred orders collapse at ten thousand. Use the bottleneck method from chapter 7 to find the step that fails next.
- Technology. Quick fixes that helped you launch (called technical debt) cost more to maintain as usage rises. Schedule time to pay down the ones that threaten reliability.
- Cash. Growth consumes cash (you pay to acquire customers who repay later). Recheck runway at each growth step.
- Culture. New people dilute the original habits. Hire for values, and make them explicit.
Paul Graham's 2013 essay "Do Things That Don't Scale" argues that early on you should do manual, personal things, such as recruiting users one by one, because they teach you what customers want. The skill is knowing when to stop: when a manual task is repeated hundreds of times, document it, then automate it.
Scale in steps, and measure after each: if you double marketing spend and CAC jumps, you have reached the limit of that channel. If you add support staff and response time does not improve, the cause is process, not people.
Common misconceptions
"Growth fixes everything." Growth multiplies what is already there. If each customer loses money or leaves quickly, faster growth makes the problem bigger.
"Our sign-ups are up, so we are fine." Sign-ups are a vanity metric unless people activate and stay.
"We should scale as soon as we can." Scale after retention is solid and unit economics work. Premature scaling is a commonly cited cause of startup failure.
Check your understanding
Quick check · 5 questions
of 5 answered You scored / 5 · perfect!
-
1. 100 users grow at 8% per week. About how many users after 10 weeks? (1.08^10 is about 2.16)
100 x 1.08^10 is about 216. -
2. Using the rule of 72, about how long does it take to double at 6% per week?
72 / 6 = 12 weeks. -
3. Each user invites 5 friends and 15% of invitees join. What is the viral coefficient?
k = 5 x 0.15 = 0.75, so each user brings fewer than one new user. -
4. Which retention curve is a better sign of product-market fit?
A curve that levels off shows a core group finds lasting value. -
5. Which is the best example of a vanity metric?
Totals only increase and do not show whether a decision worked.
Summary
- Compound growth follows
N0 × (1 + g)^t; the rule of 72 estimates doubling time. - A rough guide for young startups is 5 to 7% weekly growth, with slower rates as the company grows.
- AARRR (acquisition, activation, retention, revenue, referral) gives five numbers to track.
- Retention curves that flatten show lasting value; cohort tables reveal them.
- Prefer actionable metrics, and scale only after unit economics and retention hold up.
Track your progress
Create a free account to tick off lessons and pick up where you left off on any device.
of Entrepreneurship lessons completed