


















Lesson 18 of 49 · Business Models and Plans
The business model canvas
Learn the nine blocks of the business model canvas by Alexander Osterwalder, see a full worked example, and use it to find weak spots in your own idea.
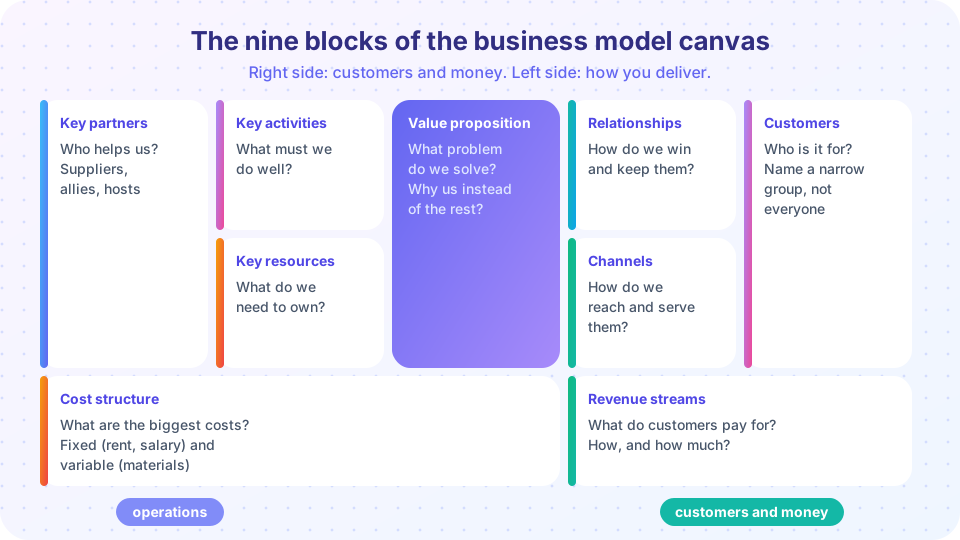
Writing a full business plan before you know whether the idea works is like drawing a detailed map of a country you have never visited. A lighter tool exists for the early stage: the business model canvas. Introduced by Alexander Osterwalder in his doctoral work and popularized in the 2010 book Business Model Generation (written with Yves Pigneur), it describes a whole business on a single page using nine building blocks.
Because the canvas is short and visual, you can sketch several versions in an afternoon, compare them, share them with customers and advisers, and change one block at a time. This lesson explains each block with questions to ask, walks through a complete example for a fictional venture and shows how to use the canvas to find weak spots.
What you will learn
- The nine blocks of the canvas and the question each one answers.
- How the right-hand and left-hand sides relate.
- How to fill in a canvas for a real or imaginary venture.
- How to spot inconsistencies and choose what to test.
Key terms
Business model: the logic of how an organization creates, delivers and captures value.
Value proposition: the bundle of products and services that solves a customer problem or satisfies a need.
Channel: the way you communicate with customers and deliver the value proposition.
Revenue stream: the cash a company earns from each customer segment.
Key resource: an important asset required to make the model work.
The nine blocks
1. Customer segments. Who are you creating value for? Name specific groups with distinct needs, not "everyone". Example: "independent cafe owners with fewer than five staff".
2. Value proposition. What problem do you solve, or what need do you satisfy? Why would a customer choose you over alternatives, including doing nothing? State it in a sentence from the customer's side: "Cafe owners get a ready-made weekly staff schedule in five minutes instead of two hours."
3. Channels. How do you reach customers to make them aware, help them evaluate, let them buy and deliver and support afterward? Examples: a website, social media, direct sales visits, resellers, a mobile app.
4. Customer relationships. What type of relationship does each segment expect? Self-service, personal assistance, automated help, a community, a dedicated account manager. Think about how you win, keep and grow customers.
5. Revenue streams. For what value are customers truly willing to pay, and how do they pay? One-time sales, subscriptions, usage fees, commissions, advertising or licensing. Note the price level for each.
6. Key resources. What assets do you need: physical (equipment, vehicles), intellectual (brand, software, data), human (specialist skills) and financial (cash, credit)?
7. Key activities. What must you do well to deliver the value proposition: production, problem-solving, running a platform or marketing?
8. Key partners. Who are the suppliers and partners that you rely on, and what do they provide? Partners reduce risk and cost but create dependency.
9. Cost structure. What are the most important costs in the model? Which key resources and activities are most expensive? Separate fixed costs (rent, salaries) from variable costs (materials per unit).
How the two sides fit
Osterwalder arranged the canvas so that the right side (customer segments, channels, relationships, revenue) is about the customer and the money, and the left side (partners, activities, resources, cost) is about how you operate and what it costs. The value proposition sits in the middle as the link: it is what the right side wants and what the left side builds. A healthy canvas balances the two: revenue from the right must exceed cost from the left, and each resource or activity should be there to deliver the value proposition.
A worked example
Consider a fictional venture called ShiftPlan, a web tool that builds staff schedules for small cafes.
- Customer segments: independent cafes and bakeries with 3 to 15 staff.
- Value proposition: a weekly schedule that respects staff availability and labor rules, created in five minutes instead of two hours; fewer scheduling arguments.
- Channels: a website with a free trial, short videos for owners, partnerships with cafe suppliers who promote it in newsletters.
- Customer relationships: self-service with email help; a personal onboarding call for the first month.
- Revenue streams: monthly subscription of 29 dollars per cafe.
- Key resources: the software, a developer, a database of local labor rules.
- Key activities: developing and maintaining the software, content marketing, customer support.
- Key partners: a cloud hosting provider, a payment processor, supplier newsletters.
- Cost structure: developer salary (fixed), hosting (semi-variable), payment fees (variable, about 3 percent of revenue), marketing (variable).
Now check consistency. The value proposition says five minutes; do the key activities include testing that promise? The channel is self-service; does the 29-dollar price cover onboarding calls? If a developer costs 3,000 dollars a month and other fixed costs add 500, how many subscribers does the venture need to break even? About 3,500 / (29 - 0.87) which is roughly 125 cafes (about 130 once you also count 1.20 dollars of hosting per cafe). Is that plausible given the segment size from Chapter 3? The canvas has turned a vague idea into questions with numbers.
Using the canvas
- Draw several versions. Try different customer segments or price models and compare.
- Mark assumptions. Put a colored dot on each box you have not verified. Test the riskiest first.
- Change one block at a time. If you switch customer segment, check how the channels, revenue and value proposition must change.
- Share and revise. Show the canvas to customers and mentors and ask where it seems weak.
The canvas is a thinking tool, not a deliverable. Update it whenever you learn something. A related tool, Ash Maurya's Lean Canvas, replaces some blocks with problem, solution, key metrics and unfair advantage; it suits very early startups.
Common misconceptions
"Filling in the boxes means the business will work." A canvas can be internally tidy and still wrong about customers. It organizes hypotheses; evidence comes from tests.
"Every box must be perfect." Early canvases are rough. Write a short answer and mark it as an assumption.
"The cost structure comes last, so it matters least." Costs decide whether the model survives. Check them early.
Try it
The first tool models ShiftPlan's break-even from the costs in the canvas. Change the price, fixed costs or payment fee and see how the number of cafes needed moves.
Press Run (or Ctrl + Enter) to see the result here.
Program input · what you'd type while the program runs
Type the answers before you press Run, one per line. Each time the program reads a line (with input()), it gets the next line from this box.
The second tool draws a simple canvas from your answers in a live HTML preview, so you can fill in the nine boxes and see them laid out. The text boxes are editable in the code.
Check your understanding
Quick check · 5 questions
of 5 answered You scored / 5 · perfect!
-
1. Who introduced the business model canvas?
Osterwalder developed it and popularized it with Yves Pigneur in Business Model Generation (2010). -
2. Which block sits in the middle and links both sides?
The value proposition is what customers want on the right and what the left side builds. -
3. Which blocks are on the customer and revenue side?
The right side of the canvas is about customers and money. -
4. Fixed costs are 3,500 and each customer contributes 28 per month. Break-even customers?
3,500 divided by 28 is 125. -
5. How should you use a first canvas?
A canvas organizes hypotheses; the evidence comes from tests.
Summary
- The canvas describes a business on one page using nine blocks.
- The right side is customers and revenue; the left side is operations and cost; the value proposition connects them.
- Fill in a worked example, check consistency and compute break-even to find weak spots.
- Draw several versions, mark assumptions and change one block at a time.
- A tidy canvas is not proof; test the riskiest boxes with customers.
Track your progress
Create a free account to tick off lessons and pick up where you left off on any device.
of Entrepreneurship lessons completed