


















Lesson 32 of 48 · Transportation Engineering
Chapter review: Transportation engineering
Review traffic flow, sight distance, curve design and pavement loading in one picture and table, then check yourself with a ten-question mixed quiz.
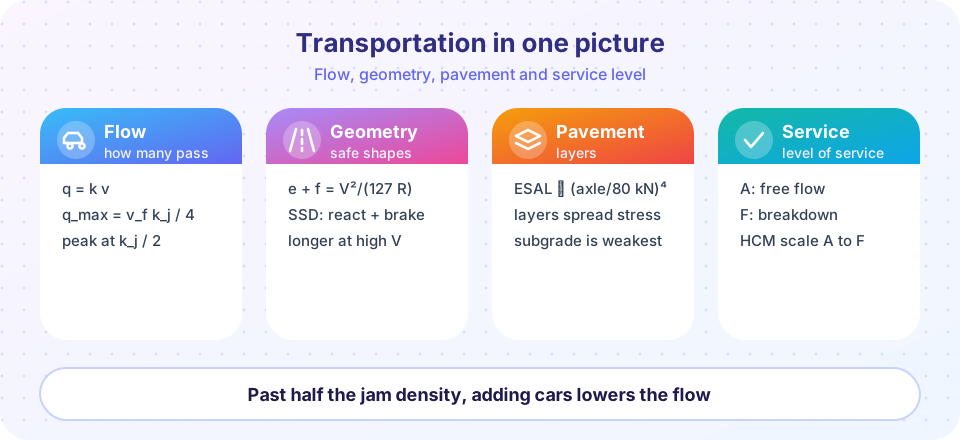
Chapter 6 gave you three lenses on a road: how many vehicles it carries, what shape keeps them safe, and what structure lets it survive them. This review puts the key formulas side by side, runs one road through all three lenses, and ends with a ten-question quiz.
What you will learn
- Which formula answers which road-design question.
- How one design speed drives flow, sight distance and curve radius.
- How to spot the traps in each formula.
Key terms
Capacity: the maximum sustainable flow, v_f k_j / 4 in the Greenshields model.
SSD: stopping sight distance, reaction plus braking.
Superelevation: banking of a curve, e.
ESAL: equivalent single axle load, the unit of pavement damage.
LOS: level of service, graded A to F.
Recap table
| Topic | Formula | Watch out for |
|---|---|---|
| Flow | q = k v |
Same q at two very different densities |
| Capacity | q_max = v_f k_j / 4 |
Occurs at k_j / 2 |
| Headway | q = 3600 / h |
h in seconds |
| SSD | 0.278 V t + V²/(254(a/9.81 + G)) |
Speed in km/h, grade as a decimal |
| Curve | e + f = V² / (127 R) |
Limits on e and f |
| ESAL factor | (axle/80 kN)⁴ |
Heavy trucks dominate |
| Wheel stress | q [1 − (1/(1+(a/z)²))^1.5] |
Falls fast with depth |
One road, three lenses
A rural highway has a design speed of 100 km/h and carries 1800 vehicles per hour per lane.
- Flow: with v_f = 100 and k_j = 100 the lane capacity is 2500 veh/h, so 1800 veh/h is 72% of capacity. Good, but not much reserve if traffic grows.
- Geometry: SSD at 100 km/h is about 183 m, so no crest or bend may hide an obstacle closer than that. With e = 0.06 and f = 0.12, the minimum curve radius is
10,000 / (127 × 0.18) ≈ 437 m. - Pavement: if 10% of the traffic is heavy trucks with 100 kN axles, those axles produce most of the damage. The pavement design is driven by ESALs, not vehicle count.
The same design speed appeared in all three. Changing it, say from 100 to 120 km/h, increases SSD, minimum radius and capacity at once.
Common misconceptions
"The faster the speed limit, the higher the capacity." Capacity depends on headways. Higher speed requires larger gaps for safety, so the gain is smaller than you think.
"A curve needs only banking." Banking is tuned to one speed. Friction handles everything else.
"Count vehicles to size a pavement." Count axle loads, because damage grows with the fourth power.
Try it
A planner's checker computes all three lenses for one road. A second tool grades traffic by density using made-up thresholds, labeled as a demonstration.
Press Run (or Ctrl + Enter) to see the result here.
Program input · what you'd type while the program runs
Type the answers before you press Run, one per line. Each time the program reads a line (with input()), it gets the next line from this box.
Press Run (or Ctrl + Enter) to see the console output here.
No output.
Check your understanding
Quick check · 10 questions
of 10 answered You scored / 10 · perfect!
-
1. A road has v_f = 80 km/h and k_j = 120 veh/km. Greenshields capacity is
80 × 120 / 4 = 2400 veh/h. -
2. At what density does that road reach capacity?
k = k_j / 2 = 60 veh/km. -
3. A 1.8-second average headway gives a lane flow of
3600 / 1.8 = 2000 veh/h. -
4. SSD at 80 km/h, t = 2.5 s, a = 3.4 m/s², level road is closest to (80² = 6400; 254 × 0.3466 ≈ 88.0)
Reaction 0.278 × 80 × 2.5 = 55.6 m, braking 6400/88.0 = 72.7 m; total ≈ 128 m. -
5. A curve with V = 60 km/h, R = 120 m, e = 0.06 needs f =
3600 / (127 × 120) = 0.236, and f = 0.236 − 0.06 ≈ 0.176 (probably too high for a design). -
6. The ESAL factor of a 160 kN axle is
(160/80)⁴ = 2⁴ = 16. -
7. Which layer is placed at the top of a flexible pavement?
The surface course sits at the top where stress is highest. -
8. Congested traffic differs from free flow in that
On the congested branch density exceeds k_j / 2 and speed is low. -
9. A shock wave with negative speed
A negative sign means opposite to the traffic direction. -
10. Which factor most strongly governs pavement damage?
Damage scales with the fourth power of axle load.
Summary
- Flow, geometry and pavement each have their own formula set, and design speed links them.
- Capacity occurs at half the jam density; congestion lowers flow.
- SSD and curve radius grow with the square of speed.
- Axle loads, not vehicle counts, size the pavement.
Track your progress
Create a free account to tick off lessons and pick up where you left off on any device.
of Civil Engineering Fundamentals lessons completed