


















Lesson 26 of 48 · Hydraulics and Water Resources
Rainfall and runoff: the rational method
Turn rainfall into design flow: catchments, rainfall intensity, runoff coefficients, the rational method and the SCS curve number method with worked examples.
Every culvert, storm drain and ditch is sized for a flow that nobody has measured yet: the flow from a storm that may come once in 10 or 100 years. Hydrology estimates that flow from rainfall and the land it falls on. This lesson covers the two most common methods: the rational method for small catchments, and the SCS curve number method, which also tells you how much rain becomes runoff.
What you will learn
- What a catchment, a design storm and a return period are.
- How to compute peak flow with Q = C i A / 360.
- How to combine several land uses into one runoff coefficient.
- How the curve number method turns storm depth into runoff depth.
Key terms
Return period (T): the average time between storms at least as big as the design storm; a 10-year storm has a 10% chance of occurring in any year. Intensity (i): rainfall depth per hour, in mm/h. Time of concentration (t_c): the time for water from the farthest point of the catchment to reach the outlet. Runoff coefficient (C): the fraction of rainfall that becomes direct runoff. Curve number (CN): a number from 0 to 100 describing how much a soil and land cover shed water.
Intensity, duration and return period
Rain is not constant. Short bursts are intense, long storms are gentler. Agencies publish intensity-duration-frequency (IDF) curves for each location. To use them you pick a return period (for example 10 years for a roadside drain, 100 years for a major river crossing), then read the intensity for a storm lasting as long as the catchment's time of concentration. Why that duration? Because only then is the whole catchment contributing to the flow at the outlet at the same time, which produces the peak.
The rational method
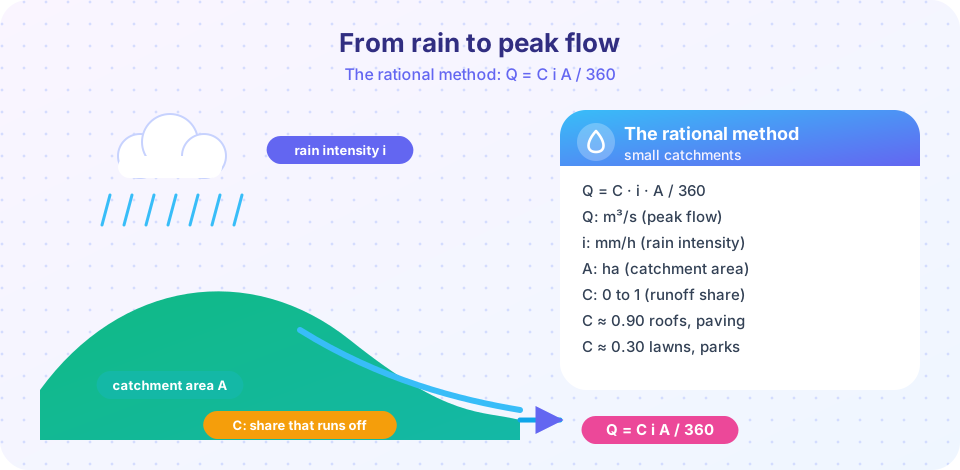
For a small catchment (a few hundred hectares at most):
Q = C i A / 360
with Q in m³/s, i in mm/h and A in hectares (1 ha = 10,000 m²). The constant 360 is just a unit conversion: 1 mm/h on 1 ha is 10 m³/h, which is 0.00278 m³/s.
| Surface | Typical C |
|---|---|
| Roofs, asphalt, concrete | 0.85 to 0.95 |
| Gravel roads | 0.50 to 0.70 |
| Residential lots | 0.30 to 0.50 |
| Lawns and parks | 0.10 to 0.30 |
| Woodland | 0.05 to 0.25 |
Worked example. A 12 ha mixed-use catchment has C = 0.6. The 10-year storm for its time of concentration has i = 80 mm/h.
Q = 0.6 × 80 × 12 / 360 = 1.60 m³/s
This is the number the culvert in the next project must carry.
Composite coefficient. If the catchment has several surfaces, weight C by area: C = Σ (C_k A_k) / Σ A_k. For 4 ha of paving (0.9) and 8 ha of lawn (0.2): C = (0.9×4 + 0.2×8)/12 = 0.433.
The curve number method
The rational method gives only a peak. The SCS curve number (developed by the US Soil Conservation Service) estimates the total runoff depth Q (in mm) from a storm of depth P (in mm):
S = 25400/CN − 254, I_a = 0.2 S, and Q = (P − I_a)² / (P − I_a + S) when P > I_a, otherwise Q = 0.
S is the soil's potential storage and I_a is the initial abstraction (rain soaked up before runoff starts). For P = 100 mm and CN = 85: S ≈ 44.8 mm, I_a ≈ 9.0 mm, and Q ≈ 61 mm. A parking lot has CN near 98; woodland in good condition has CN around 55 or less.
Where the rain goes
Not all rainfall becomes runoff. Part is caught by leaves (interception), part fills puddles (depression storage), part soaks into the ground (infiltration) and part later evaporates. Paving and roofs remove almost all of those losses, which is why urbanization raises flood peaks: the same storm now produces more runoff, sooner. Chapter 8 returns to this when it covers green infrastructure that restores some of the lost storage.
Common misconceptions
"A 100-year storm happens once every 100 years." It has a 1% chance in any given year, and two such storms can occur in consecutive years.
"Use the longest storm to be safe." A longer storm has a smaller intensity. The critical duration is the time of concentration, which gives the highest flow.
"C is a property of the land alone." It also rises for rare storms and steep or saturated ground, so many agencies adjust C upward for large return periods.
Try it
Plot the curve number relationship, then compute a composite runoff coefficient and a peak flow for a mixed catchment.
Press Run (or Ctrl + Enter) to see the result here.
Program input · what you'd type while the program runs
Type the answers before you press Run, one per line. Each time the program reads a line (with input()), it gets the next line from this box.
Press Run (or Ctrl + Enter) to see the console output here.
No output.
Check your understanding
Quick check · 5 questions
of 5 answered You scored / 5 · perfect!
-
1. A 20 ha catchment has C = 0.5 and i = 90 mm/h. What is the peak flow using Q = C i A / 360?
Q = 0.5 × 90 × 20 / 360 = 2.5 m³/s. -
2. Which surface typically has the highest runoff coefficient C?
Asphalt is nearly impermeable, so C is about 0.85 to 0.95. -
3. Why is the design storm duration set equal to the time of concentration?
Longer storms are less intense; shorter ones do not let the far end contribute. -
4. A storm has a 4% chance of being equaled or exceeded in any year. Its return period is
The return period is 1 divided by the annual exceedance probability: 1/0.04 = 25 years. -
5. What happens to flood peaks when a field is paved?
Paving removes infiltration and storage, so more rain runs off and reaches the outlet faster.
Summary
- Peak flow for small catchments is
Q = C i A / 360(m³/s, mm/h, ha). - Choose i from an IDF curve using a design return period and the time of concentration.
- Weight C by area for mixed land uses.
- The curve number method turns storm depth into runoff depth.
- Urbanization raises flood peaks by removing natural storage.
Track your progress
Create a free account to tick off lessons and pick up where you left off on any device.
of Civil Engineering Fundamentals lessons completed