


















Lesson 34 of 48 · Geotechnical Engineering
Soil phases and classification
Learn the soil phase diagram, void ratio, water content, unit weights, grain-size curves and Atterberg limits with worked laboratory-style examples.
A handful of soil seems simple until you ask how much of it is solid. Dry it in an oven and it loses weight, which means water was hiding in it. Look at it under a lens and you find gaps between the grains. Soil engineers measure these things with a small set of definitions called phase relations, then group soils by grain size and plasticity so that experience from one site can be applied at another.
What you will learn
- How to read and use the three-phase diagram.
- How to compute void ratio, porosity, water content and unit weights.
- How grain-size curves describe a soil.
- What the Atterberg limits tell you about clay.
Key terms
Void ratio (e): volume of voids divided by volume of solids. Water content (w): weight of water divided by weight of solids. Degree of saturation (S): volume of water divided by volume of voids. Specific gravity of solids (Gs): density of the grains divided by density of water; about 2.65 to 2.75 for most mineral soils. Plasticity index (PI): liquid limit minus plastic limit.
The three-phase diagram
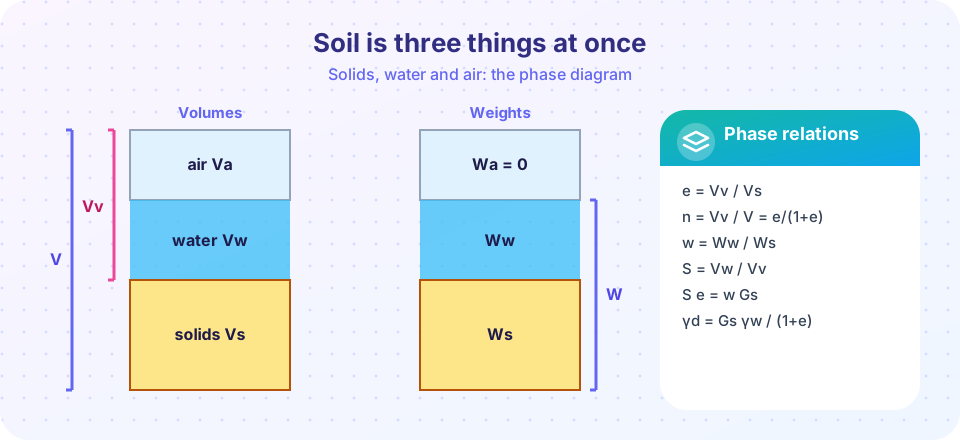
Draw soil as a column split into air, water and solids. The voids are the air plus water: V_v = V_a + V_w. Total volume is V = V_s + V_v. The air has no weight, so total weight W = W_s + W_w.
The main definitions:
- Void ratio:
e = V_v / V_s - Porosity:
n = V_v / V = e / (1 + e) - Water content:
w = W_w / W_s(often written as a percent) - Degree of saturation:
S = V_w / V_v - Key relation:
S e = w G_s
A soil with S = 0 is dry, with S = 1 (100%) is saturated. Unit weights follow with γ_w = 9.81 kN/m³:
- Bulk:
γ = (G_s + S e) γ_w / (1 + e) - Dry:
γ_d = G_s γ_w / (1 + e) - Saturated:
γ_sat = (G_s + e) γ_w / (1 + e)
Worked example 1. A saturated clay has G_s = 2.70 and e = 0.65.
w = e / G_s = 0.65 / 2.70 = 0.241(24.1%).γ_sat = (2.70 + 0.65) × 9.81 / 1.65 ≈ 19.9 kN/m³.γ_d = 2.70 × 9.81 / 1.65 ≈ 16.1 kN/m³.
Worked example 2 (from a lab). A tube sample of 100 cm³ has a wet mass of 185 g and a dry mass of 160 g, with G_s = 2.70. Then:
- Bulk density 1.85 g/cm³, dry density 1.60 g/cm³.
w = 25 / 160 = 15.6%.e = G_s ρ_w / ρ_d − 1 = 2.70 / 1.60 − 1 = 0.6875.S = w G_s / e = 0.156 × 2.70 / 0.6875 ≈ 61%, so the sample is partly saturated.
Grain size
Coarse soils (sand and gravel) are classified by sieving. The grain-size curve plots percent passing against particle size on a log axis. Three sizes matter: D10, D30 and D60 (the diameters below which 10%, 30% and 60% of the soil passes). From them:
- Uniformity coefficient:
C_u = D60 / D10 - Curvature coefficient:
C_c = D30² / (D10 × D60)
A sand is well graded if C_u ≥ 6 and 1 ≤ C_c ≤ 3 (for gravel C_u ≥ 4). For D10 = 0.1 mm, D30 = 0.3 mm and D60 = 0.9 mm: C_u = 9 and C_c = 1.0, so it is well graded. Well-graded soils pack tightly because small grains fill the gaps between large ones, giving high strength and low compressibility.
In the Unified Soil Classification System (USCS) the size boundaries are roughly: gravel above 4.75 mm, sand from 0.075 to 4.75 mm, and fines (silt and clay) below 0.075 mm.
Plasticity of fine soils
Silts and clays cannot be classified by sieving. Their behavior depends on water content. Albert Atterberg, a Swedish scientist, defined limits around 1911 that Arthur Casagrande later standardized:
- Liquid limit (LL): the water content at which soil starts to flow like a liquid.
- Plastic limit (PL): the water content at which it begins to crumble when rolled into threads.
- Plasticity index:
PI = LL − PL.
A clay with LL = 55% and PL = 25% has PI = 30%, which is highly plastic. Casagrande's plasticity chart separates clays from silts with the A-line, PI = 0.73 (LL − 20). A soil above this line is a clay (C); below it a silt (M). High-plasticity clays swell when wet and shrink when dry, which cracks buildings.
Common misconceptions
"A saturated soil has no air, so its water content is 100%." Water content compares weights of water and solids; a saturated soil can have w = 24%. Saturation S is a different quantity.
"Clay is just very small sand." Clay minerals are plate-like and carry electrical charges, so clay behaves very differently from sand, with plasticity and long consolidation times.
"Porosity above 50% is impossible." Some clays and organic soils have void ratios above 1, which means porosity above 50%.
Try it
First, compute phase relations for any soil. Then draw a grain-size curve and read off C_u and C_c.
Press Run (or Ctrl + Enter) to see the result here.
Program input · what you'd type while the program runs
Type the answers before you press Run, one per line. Each time the program reads a line (with input()), it gets the next line from this box.
Press Run (or Ctrl + Enter) to see the result here.
Program input · what you'd type while the program runs
Type the answers before you press Run, one per line. Each time the program reads a line (with input()), it gets the next line from this box.
Check your understanding
Quick check · 5 questions
of 5 answered You scored / 5 · perfect!
-
1. What is the void ratio of a soil with V_v = 0.4 m³ and V_s = 0.8 m³?
e = V_v / V_s = 0.4 / 0.8 = 0.5. -
2. A saturated soil has Gs = 2.65 and e = 0.80. Its water content is about
For S = 1, w = e / Gs = 0.80 / 2.65 ≈ 0.302. -
3. A sand has D10 = 0.2, D30 = 0.5 and D60 = 1.2 mm. Its Cu is
Cu = D60 / D10 = 1.2 / 0.2 = 6.0. -
4. A clay has LL = 48% and PL = 22%. Its plasticity index is
PI = LL − PL = 26%. -
5. Which of these does the degree of saturation compare?
S = V_w / V_v. Water content compares weights, and the void ratio compares voids to solids.
Summary
- The three-phase diagram links volumes and weights of solids, water and air.
- Key relations:
e = V_v/V_s,w = W_w/W_s,S e = w G_s. - Unit weights follow from G_s, e and S.
- Grain-size curves give C_u and C_c; fine soils use Atterberg limits and PI.
Track your progress
Create a free account to tick off lessons and pick up where you left off on any device.
of Civil Engineering Fundamentals lessons completed