


















Lesson 40 of 48 · Environmental and Sustainable Design
Stormwater and green infrastructure
See how urbanization raises flood peaks and how swales, rain gardens, permeable paving and detention ponds slow runoff, with a simple storage volume calculation.
For most of history, cities treated rain as a nuisance to be removed as fast as possible: pave the ground, dig a pipe, send the water downstream. That works until the downstream town floods. Modern stormwater design aims to do the opposite, to slow, store, filter and soak rain close to where it falls. This lesson shows why the old approach causes floods and how the new tools work, including a simple calculation for the size of a detention pond.
What you will learn
- Why paving raises flood peaks and shortens the time to peak.
- The main green infrastructure tools and what each does.
- How to size a detention basin for a triangular inflow.
- Why water quality, not only quantity, matters.
Key terms
Impervious surface: a surface that water cannot soak through, such as a roof or road. Hydrograph: a graph of flow against time at a point. Detention: temporarily storing runoff and releasing it slowly. Infiltration: water soaking into the ground. Green infrastructure (also called SuDS or LID): drainage that uses soil, plants and storage to mimic natural processes.
What urbanization does to a hydrograph
Take the 12 ha catchment from the hydrology lesson. Before development, mostly meadow with C = 0.3, a storm of 80 mm/h gives Q = 0.3 × 80 × 12 / 360 = 0.80 m³/s. After development, with C = 0.8, the same storm gives Q = 0.8 × 80 × 12 / 360 = 2.13 m³/s. Peak flow rises by a factor of 2.7. Paved surfaces and pipes also shorten the time of concentration, so the peak arrives earlier and sharper. Downstream channels, built for the old flows, overflow and erode.
Runoff also carries pollution: oil and metals from roads, nutrients from lawns, litter and sediment. The first part of a storm, the first flush, is often the dirtiest.
The toolbox
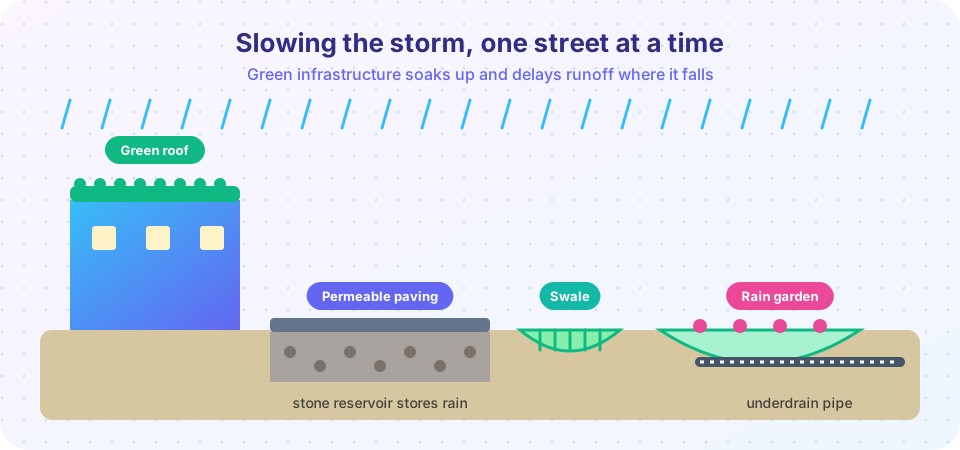
- Green roofs: a layer of soil and plants on a roof holds some rain and returns it to the air by evaporation and plant uptake; the roof also cools the building.
- Permeable paving: surfaces that let water pass into a stone layer below, where it is stored, filtered and infiltrates or drains slowly.
- Swales: wide, shallow, grassy ditches that slow the flow, filter it and let it soak in.
- Rain gardens (bioretention): planted depressions with engineered soil. Water ponds briefly, soaks in, and an underdrain carries any excess away.
- Detention basins and ponds: larger storage areas that fill during a storm and release through a small outlet.
- Wetlands: shallow vegetated basins that treat water through settling and plant uptake.
These tools work together as a management train: control at the source, then along the way, then at the site's end. They also provide extra benefits: shade, habitat, recreation, lower temperatures. Limits exist: infiltration needs permeable soil and a safe distance from foundations, and plants need maintenance.
Sizing a detention basin
Approximate the inflow hydrograph as a triangle with peak Q_p and base time T_b. If the basin releases a constant allowed flow Q_o, the storage needed equals the area of the inflow triangle above Q_o. By similar triangles the portion above Q_o has height Q_p − Q_o and base T_b (Q_p − Q_o) / Q_p, so
V = ½ T_b (Q_p − Q_o)² / Q_p
Worked example. After development the peak is 2.13 m³/s over a base of 60 minutes (3600 s), and the downstream channel can take only the old peak, 0.80 m³/s.
V = ½ × 3600 × (2.13 − 0.80)² / 2.13 = ½ × 3600 × 1.769 / 2.13 ≈ 1500 m³
A pond 1.5 m deep would need about 1000 m² of surface, a plot about 32 m by 32 m. This is a first estimate. Real designs route the inflow through the outlet structure with several return periods and add a margin and an emergency spillway for storms bigger than the design storm.
Common misconceptions
"Pipes bigger than needed solve flooding." Larger pipes move the flood downstream and can make it worse.
"Green infrastructure replaces pipes entirely." It reduces and delays flows for small and moderate storms. Extreme storms still need conventional drainage and flood paths.
"Permeable paving never clogs." Fine sediment can block pores, so vacuum sweeping and good upstream control are part of maintenance.
Try it
Compare pre- and post-development hydrographs and see how detention flattens the peak, then compute the storage volume for any inputs.
Press Run (or Ctrl + Enter) to see the result here.
Program input · what you'd type while the program runs
Type the answers before you press Run, one per line. Each time the program reads a line (with input()), it gets the next line from this box.
Press Run (or Ctrl + Enter) to see the console output here.
No output.
Check your understanding
Quick check · 5 questions
of 5 answered You scored / 5 · perfect!
-
1. What happens to flood peaks when meadow becomes parking lot?
Less infiltration and faster flow raise the peak and shorten its time to arrive. -
2. Which feature stores water in a stone layer below a traffic surface?
Permeable paving lets water pass into a stone reservoir beneath. -
3. What is the purpose of a detention basin?
It flattens the peak flow leaving a site. -
4. Peak inflow 3 m³/s, release 1 m³/s, base 30 minutes. Storage ≈ ½ × 1800 × (2)² / 3 =
½ × 1800 × 4 / 3 = 1200 m³. -
5. Why is infiltration not always possible?
Clay soils, high water tables and nearby foundations can rule it out.
Summary
- Urbanization raises and sharpens flood peaks and pollutes runoff.
- Green infrastructure slows, stores, filters and infiltrates rain close to the source.
- Detention volume for a triangular hydrograph:
V = ½ T_b (Q_p − Q_o)² / Q_p. - Combine tools in a management train, and plan for maintenance.
Track your progress
Create a free account to tick off lessons and pick up where you left off on any device.
of Civil Engineering Fundamentals lessons completed