


















Lesson 40 of 49 · Failure Theories and Design
Fatigue and notches: failure under repeated loads
Understand fatigue failure under repeated loads: stress amplitude, the S-N curve, endurance limit, notch effects Kt and Kf, and the Goodman mean-stress line.
Bend a paper clip once and it hardly notices. Bend it back and forth a few dozen times and it snaps, even though no single bend was anywhere near its breaking load. That is fatigue: failure caused by repeated (cyclic) loading at stress levels well below the yield strength. It accounts for the great majority of failures of moving machine parts, such as shafts, springs, connecting rods and aircraft structures. The tricky part is that a fatigue failure looks sudden, but it has been growing quietly for thousands or millions of cycles.
What you will learn
- The vocabulary of cyclic stress: amplitude, mean, range and ratio.
- How to read an S-N curve and what the endurance limit means.
- How notches raise local stress (
Kt) and how fatigue sees them (Kf). - How to check a part with mean stress using the Goodman line.
Key terms
- Stress amplitude
σa: half the range of the stress cycle,(σmax − σmin)/2. - Mean stress
σm: the average,(σmax + σmin)/2. - S-N curve: plot of stress amplitude against the number of cycles to failure.
- Endurance limit
Se: the stress amplitude below which some materials (notably steels) can run for a very large number of cycles without failing. - Stress concentration factor
Kt: the ratio of the peak local stress to the nominal stress.
How fatigue happens
A fatigue failure has three stages. First, a microscopic crack starts, typically at the surface, at a notch, scratch, sharp corner, weld toe or inclusion, where the local stress is highest. Second, the crack grows a tiny amount with every cycle. Third, the remaining section becomes too small to carry the load and breaks suddenly. The fracture surface often shows smooth "beach marks" where the crack grew and a rough patch where the final break happened.
Describing a stress cycle
A common test is a rotating shaft with a bending load: any point on the surface goes from tension to compression and back again each turn, a fully reversed cycle with σm = 0. In general:
σa = (σmax − σmin) / 2 σm = (σmax + σmin) / 2 R = σmin / σmax
A fully reversed cycle has R = −1. A cycle that goes from zero to a peak has R = 0 and σm = σa.
The S-N curve
Fatigue tests subject many identical specimens to different stress amplitudes and record the number of cycles N to failure. Plotting σa against N on a logarithmic horizontal axis gives the S-N curve.
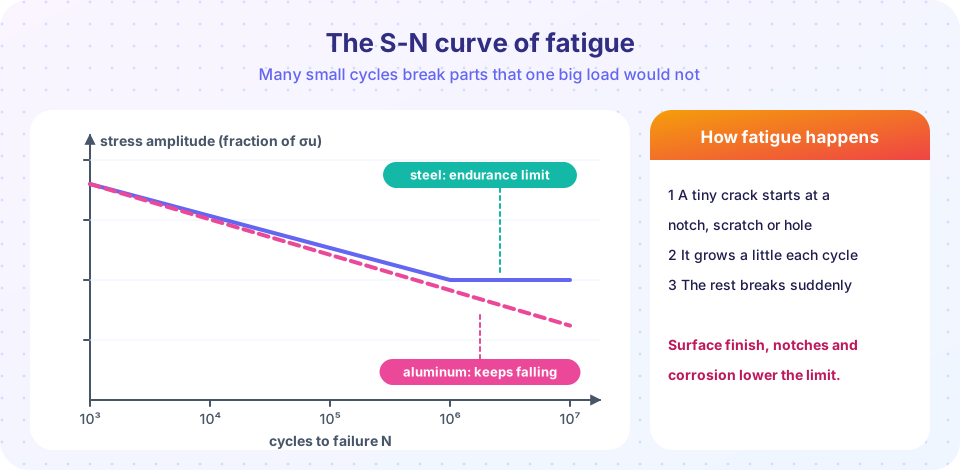
- Low stress and many cycles on the right: high-cycle fatigue. Between about
10³and10⁶cycles the curve falls roughly in a straight line on a log plot. - For many steels, the curve levels out at the endurance limit; as a rough rule of thumb,
Se' ≈ 0.5 σufor steels withσuup to about 1400 MPa, measured on small, polished, carefully made specimens. - Aluminum and many other metals have no true limit. Engineers quote the fatigue strength at a given life, such as
5 × 10⁸cycles.
From specimen to real part
The laboratory limit Se' is almost never the right number for your part. Corrections, usually written as multiplying factors, account for the surface finish (a ground surface is better than a rough forged one), the size (larger parts fail at lower stress), the type of loading, temperature and the required reliability. For example, an illustrative set could be Se = 0.8 × 0.85 × Se' = 0.68 Se'. Real values come from handbooks and testing; the point is that the working endurance limit can easily be 30% to 50% lower than the textbook value.
Notches and the fatigue notch factor
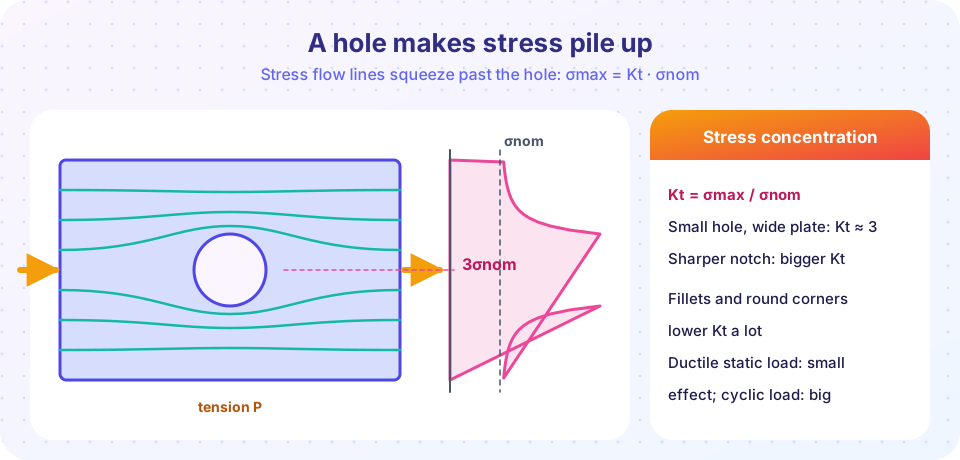
A hole, groove, fillet or keyway disturbs the flow of stress. For a small circular hole in a wide plate in tension, the peak stress at the edge is 3 times the nominal stress, so Kt = 3; sharper notches give larger Kt. You met the idea in the lesson on stress concentrations; here it matters for the cyclic case.
For a static load on a ductile material, local yielding blunts the notch and the effect is small. For fatigue it is large, but usually somewhat smaller than Kt, because a very small region of high stress does not do as much damage. The fatigue notch factor is
Kf = 1 + q (Kt − 1) with q between 0 (no notch effect) and 1 (full effect)
and the peak cyclic stress used for the check is Kf · σa.
Mean stress and the Goodman line
A tensile mean stress makes fatigue worse. A simple and conservative way to combine amplitude and mean is the modified Goodman line:
σa / Se + σm / σu = 1 / n
where n is the fatigue factor of safety. If the left side is 1 or less, the part has a margin.
Worked example
A steel shaft (σu = 500 MPa) is a rotating beam with a shoulder fillet. The nominal stress amplitude at the shoulder is σa = 100 MPa (fully reversed). The lab endurance limit is Se' = 0.5 × 500 = 250 MPa.
- Correct for surface and size:
Se = 250 × 0.8 × 0.85 = 170 MPa. - Without the notch:
n = Se/σa = 170/100 = 1.7. - Notch:
Kt = 2andq = 0.8giveKf = 1 + 0.8 × 1 = 1.8, so the effective amplitude is180 MPa.n = 170/180 = 0.94: the shaft is predicted to fail in fatigue, even though the nominal stress is a small fraction of yield! - A generous fillet radius lowering
Ktto 1.4 givesKf = 1.32, an effective amplitude of 132 MPa, andn = 1.29.
Add a tensile mean stress σm = 100 MPa to the same fatigue state (with σa = 80 MPa and no notch for simplicity): 80/170 + 100/500 = 0.47 + 0.20 = 0.67, so n = 1/0.67 = 1.49.
Common misconceptions
- "If the stress is below yield, the part is safe." Under cyclic loading, parts fail at stresses far below yield. Check fatigue whenever the load repeats.
- "Stronger steel always means better fatigue life." Higher strength raises the endurance limit somewhat, but also makes the material more notch sensitive. A scratch or sharp corner can wipe out the gain.
- "A part that survived a million cycles is fine forever." Only if the stress is below the endurance limit and the part is not damaged or corroded; for aluminum there is no true limit.
- "Kt applies the same way to static and fatigue loads." In ductile static loading it is often ignored; in fatigue use
Kf.
Try it
The first TryIt is a fatigue calculator for the shaft example, with and without the notch and mean stress. Change the numbers to see how quickly the margin disappears.
Press Run (or Ctrl + Enter) to see the result here.
Program input · what you'd type while the program runs
Type the answers before you press Run, one per line. Each time the program reads a line (with input()), it gets the next line from this box.
The second TryIt draws an S-N curve from two points using Basquin's power law σa = A·N^b, then cuts it off at the endurance limit.
Press Run (or Ctrl + Enter) to see the result here.
Program input · what you'd type while the program runs
Type the answers before you press Run, one per line. Each time the program reads a line (with input()), it gets the next line from this box.
Check your understanding
Quick check · 5 questions
of 5 answered You scored / 5 · perfect!
-
1. A cycle goes from σmin = −40 MPa to σmax = +120 MPa. What are σa and σm?
σa = (120 − (−40))/2 = 80 MPa and σm = (120 + (−40))/2 = 40 MPa. -
2. What is the stress ratio R of a fully reversed cycle?
σmin = −σmax gives R = −1. -
3. A notch has Kt = 2.5 and notch sensitivity q = 0.6. What is Kf?
Kf = 1 + q(Kt − 1) = 1 + 0.6 × 1.5 = 1.9. -
4. Using the Goodman line with Se = 200, σu = 600, σa = 100 and σm = 120 MPa, what is the factor of safety n?
100/200 + 120/600 = 0.5 + 0.2 = 0.7, so n = 1/0.7 = 1.43. -
5. Why is aluminum treated differently from steel in fatigue design?
Aluminum's S-N curve keeps falling, so designers quote strength at a specified number of cycles.
Summary
- Fatigue is failure under repeated loading at stresses below yield: a crack starts, grows a little per cycle, then the part snaps.
- A cycle is described by
σa,σmandR; the S-N curve plotsσaagainst cycles to failure. - Steels often show an endurance limit near
0.5 σuin the lab; real parts need correction factors that can lower it a lot. - Notches raise local stress by
Kt; in fatigue useKf = 1 + q(Kt − 1); smooth fillets and good surfaces help. - The modified Goodman line
σa/Se + σm/σu = 1/naccounts for a tensile mean stress.
Track your progress
Create a free account to tick off lessons and pick up where you left off on any device.
of Strength of Materials lessons completed