


















Lesson 11 of 48 · Pharmacokinetics
Chapter 3 overview: pharmacokinetics
Preview chapter 3: the ADME journey of a drug, the concentration-time curve with Cmax, Tmax and AUC, and what each lesson in the chapter covers, with an ADME hero picture and a simulation.
Chapter 2 told you what a drug can do once it reaches its target. Chapter 3 asks the earlier question: how much drug gets there, and for how long? The answer decides the dose, the schedule and the safety of almost every medicine. Pharmacokinetics (PK) follows the drug from the moment it is given until the last molecule leaves the body, and it uses a few tidy quantities to describe the whole trip.
What you will learn
- The four ADME processes and how they fit together.
- How to read a concentration-time curve: Cmax, Tmax and AUC.
- What each lesson in this chapter covers.
- A first model that reproduces the curve of an oral dose.
Key terms
- ADME: absorption, distribution, metabolism and excretion; metabolism and excretion together are called elimination.
- Plasma concentration: the amount of drug per volume of blood plasma, usually in mg/L or ng/mL.
- Cmax and Tmax: the peak concentration and the time at which it occurs.
- AUC: the area under the concentration-time curve, a measure of total exposure.
- Systemic circulation: the blood flowing through the body as a whole, as opposed to the gut and liver circulation.
The journey
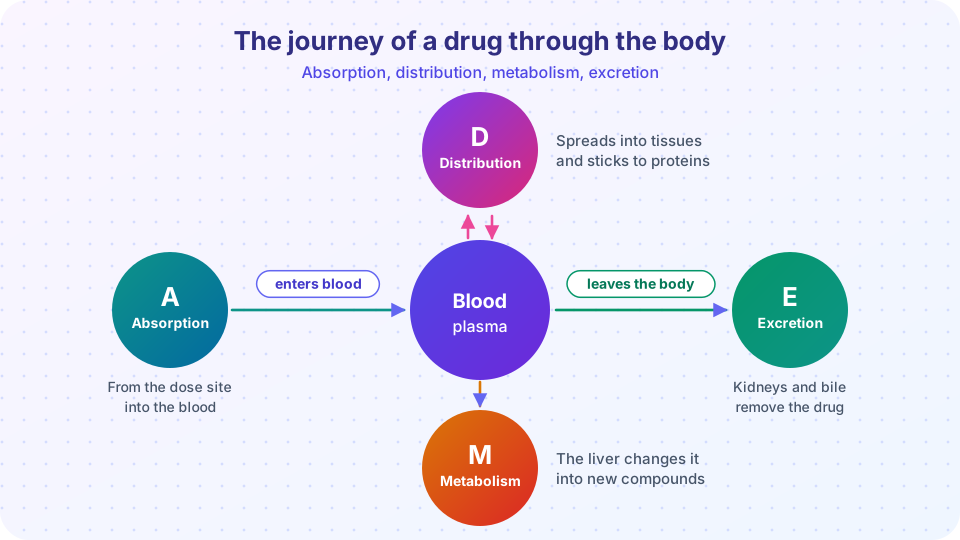
Look at the picture. Blood plasma sits at the centre because it is the compartment that doctors can measure, and it connects everything else.
- Absorption is the movement of the drug from the site of administration into the blood. IV doses skip it, because they start in the blood.
- Distribution is the reversible spread of drug from the blood into tissues and its binding to proteins. A drug that is very widely distributed can have a low concentration in plasma even though the body holds a lot of it.
- Metabolism is the chemical alteration of the drug, mostly in the liver, usually making it more water-soluble and often less active.
- Excretion is the removal of the drug and its metabolites from the body, mostly through the kidneys into urine and through the liver into bile.
These processes happen at the same time, not one after another. During the first hour after a tablet, absorption is dominant; later, elimination takes over, and the curve falls.
Reading the curve
If you take blood samples after a single oral dose and plot concentration against time, you get a rise, a peak and a fall. Three numbers summarize it:
- Cmax is the highest concentration. Too high may mean toxicity; too low may mean no effect.
- Tmax is the time of Cmax. It reflects absorption speed.
- AUC is the area under the curve, found by adding up concentration times time. It measures how much drug the body is exposed to in total and is the main quantity used to compare formulations and to calculate bioavailability.
A minimum effective concentration (MEC) and a minimum toxic concentration (MTC) frame the curve for many drugs. The ideal dosing plan keeps concentrations inside that therapeutic window most of the time. A fast-rising, high-peaking curve is more likely to cross the toxic line; a slow, flat curve is more likely to stay inside the window.
What is in this chapter
- Absorption and bioavailability explains how drugs cross membranes, why pH matters, and what the first-pass effect and the symbol F mean.
- Distribution introduces the volume of distribution, protein binding, barriers such as the blood-brain barrier, and the loading dose.
- Drug metabolism covers phase I and II reactions, the cytochrome P450 enzymes, induction and inhibition, and saturable (zero-order) metabolism.
- Elimination, clearance and half-life shows how the kidney and liver clear drug, how to calculate half-life, and how repeated doses build up to steady state.
- Chapter 3 review gathers the formulas and gives a longer quiz.
The ADME story
Together these set how long and how high.
Numbers you will use
Four numbers describe most drugs.
A first model
The classic model for an oral dose treats the body as one well-mixed compartment. The drug enters at a first-order rate ka and leaves at a first-order rate k. The concentration is then:
C(t) = F × Dose × ka / (Vd × (ka - k)) × (e^(-k t) - e^(-ka t))
The time of the peak follows from setting the slope to zero: Tmax = ln(ka / k) / (ka - k). The simulation below uses made-up numbers for an imaginary drug and finds Cmax, Tmax and the AUC by simple summation, then compares AUC with the exact formula F × Dose / CL, where CL = k × Vd.
Press Run (or Ctrl + Enter) to see the result here.
Program input · what you'd type while the program runs
Type the answers before you press Run, one per line. Each time the program reads a line (with input()), it gets the next line from this box.
Common misconceptions
- "Blood concentration is the concentration at the target." Plasma levels are a convenient proxy. The concentration at the target tissue may be higher or lower, and may lag behind plasma.
- "Elimination is the same as excretion." Excretion removes the molecule unchanged; elimination includes metabolism too.
- "A higher AUC always means a stronger effect." AUC measures exposure, but effect also depends on peak, timing and the dose-response relationship.
Check your understanding
Quick check · 4 questions
of 4 answered You scored / 4 · perfect!
-
1. Which processes together are called elimination?
Elimination removes active drug from the body, either by changing it (metabolism) or excreting it. -
2. Tmax is
Cmax is the peak concentration, Tmax the time of the peak, AUC the total exposure. -
3. Which curve is more likely to stay inside the therapeutic window?
A flatter curve is less likely to cross the minimum toxic concentration. -
4. What does AUC measure?
It is the area under the concentration-time curve.
Summary
- ADME describes the journey: absorption, distribution, metabolism, excretion; the last two form elimination.
- The concentration-time curve is summarized by Cmax, Tmax and AUC.
- A one-compartment model with first-order absorption and elimination reproduces the shape of an oral curve.
- This chapter covers absorption, distribution, metabolism, and elimination with half-life.
Track your progress
Create a free account to tick off lessons and pick up where you left off on any device.
of Pharmacology lessons completed