


















Lesson 17 of 48 · Pharmacodynamics and Dose-Response
Chapter 4 overview: pharmacodynamics and dose-response
Preview chapter 4: how concentration becomes effect, the dose-response curve, potency, efficacy, safety margins, variability and interactions, with a staircase picture and a PK-to-PD simulation.
Pharmacokinetics tells you how much drug is at the target. Pharmacodynamics (PD) tells you what that drug does there. The two fit together like the two halves of a bridge: PK carries the dose to a concentration, PD turns the concentration into an effect. Chapter 4 completes the toolkit by describing the relationship between dose or concentration and effect, comparing drugs, measuring safety, and explaining why different people respond differently.
What you will learn
- The chain from dose to clinical effect, and which parts are PK and which PD.
- What each lesson in this chapter covers.
- How a concentration curve over time becomes an effect curve over time.
Key terms
- Dose-response relationship: how the size of an effect depends on the dose or concentration.
- Emax: the maximum effect a drug can produce.
- EC50: the concentration that gives half of the maximum effect.
- Therapeutic window: the range of concentration or dose that gives benefit with acceptable harm.
- Variability: differences between individuals in dose needed or response seen.
The chain from dose to effect
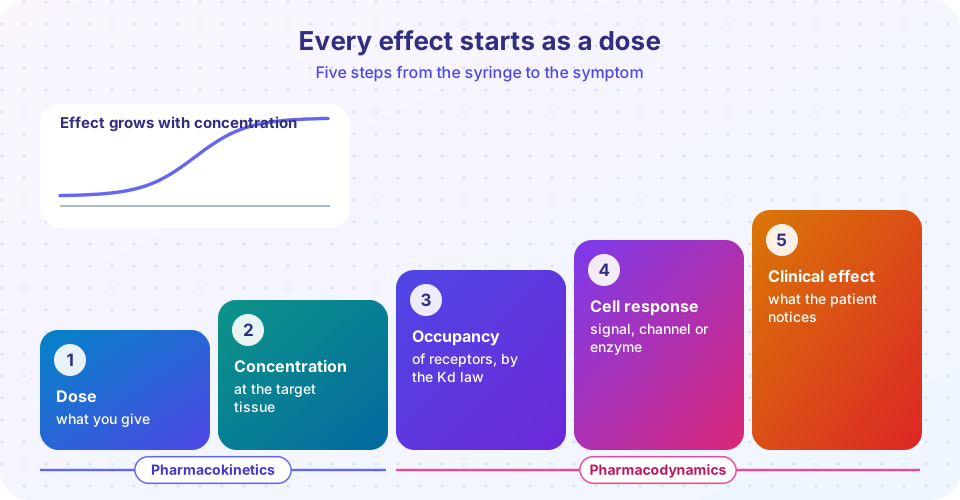
Look at the staircase. Each step depends on the one before it, and a change at any step changes the result.
- Dose is what you give. It is under the control of the prescriber.
- Concentration at the target is set by PK: absorption, distribution, metabolism and excretion (Chapter 3).
- Receptor occupancy follows the binding law of Chapter 2: occupancy = [L] / ([L] + Kd).
- Cell and tissue response follows from occupancy, amplified or damped by the cell's signalling machinery.
- Clinical effect is what the patient notices or what a test measures: a lower blood pressure, relief from pain, a lower blood sugar.
Because the steps are chained, you can often reason about a surprising result by finding the step where something differs. A patient who has little response to a normal dose may have low concentration (a PK cause, such as fast metabolism), low occupancy (a binding cause), a weak cell response (a PD cause, such as down-regulated receptors) or a disease that overrides the drug.
What chapter 4 adds
Four ideas turn kinetics into good prescribing.
Two curves to remember
Graded: one person or tissue. Quantal: a population.
What is in this chapter
- Dose-response curves explains graded and quantal curves, the Emax and Hill equations, why we plot on log axes, and how to fit EC50 from data.
- Potency, efficacy and safety separates potency from efficacy, and introduces the therapeutic index, margins of safety and the therapeutic window.
- Variability and pharmacogenomics covers why responses differ: age, disease, tolerance, placebo effects and genes such as CYP2D6.
- Drug interactions shows how drugs change each other's kinetics and effects, and how to think about additive, synergistic and antagonistic combinations.
- Chapter 4 review gathers the formulas and gives a longer quiz.
From a concentration curve to an effect curve
The simplest PD model is the Emax model: E = Emax × C / (EC50 + C). Plug in the concentration of the PK model at each moment and you obtain an effect-time curve. The simulation below does exactly that with made-up numbers. Notice two things. The effect curve is flatter on top than the concentration curve, because the Emax model saturates, and the duration of effect (time with effect above, say, 50%) depends on the concentration staying above the EC50.
Press Run (or Ctrl + Enter) to see the result here.
Program input · what you'd type while the program runs
Type the answers before you press Run, one per line. Each time the program reads a line (with input()), it gets the next line from this box.
Common misconceptions
- "Effect is proportional to dose." Effect follows a saturating curve, so doubling the dose rarely doubles the effect.
- "Plasma concentration is the effect." There may be a delay between concentration and effect, and the relationship is curved, not linear.
Check your understanding
Quick check · 3 questions
of 3 answered You scored / 3 · perfect!
-
1. Which step in the staircase is a pharmacokinetic step?
The concentration reaching the target is set by absorption, distribution, metabolism and excretion. -
2. In the Emax model, what is the effect when C = EC50?
E = Emax x EC50 / (EC50 + EC50) = Emax / 2. -
3. A patient has little response to a normal dose. Which could explain it?
Both PK causes (low concentration) and PD causes (weak response) are possible.
Summary
- The chain is dose, concentration, occupancy, cell response, clinical effect; the first two steps are PK, the rest PD.
- The Emax model turns a concentration curve into an effect curve: E = Emax x C / (EC50 + C).
- Chapter 4 covers dose-response curves, potency and efficacy, safety, variability and interactions.
Next: Dose-response curves
Track your progress
Create a free account to tick off lessons and pick up where you left off on any device.
of Pharmacology lessons completed