


















Lesson 18 of 48 · Pharmacodynamics and Dose-Response
Dose-response curves: graded, quantal, Emax and the Hill equation
Understand graded and quantal dose-response curves, why log axes are used, the Emax and Hill equations, spare receptors and how to estimate EC50 from data, with plots and a curve designer.
If you measure the effect of a drug at several doses, the points almost always fall on a curve with the same basic shape: flat at low doses, rising through a steep middle section, and levelling off at a ceiling. This relationship is the single most important picture in pharmacodynamics. It tells you how much drug is needed, how much more would be wasted, where side effects might appear, and how to compare one drug with another. In this lesson you learn the two kinds of dose-response curve, the equations that describe them, and how to extract numbers from real data.
What you will learn
- The difference between graded and quantal dose-response curves.
- How to use the Emax equation and the Hill equation, and what the Hill slope means.
- Why dose-response data are plotted on a logarithmic axis.
- How to estimate EC50, Emax and slope from measurements.
Key terms
- Graded response: a continuous effect measured in one subject or tissue, such as the fall in blood pressure in mm Hg.
- Quantal response: an all-or-none effect counted across a population, such as the number of patients whose pain is relieved.
- EC50 / ED50: the concentration or dose that produces 50% of the maximum effect, or an effect in 50% of the population.
- Hill slope (n): a number describing the steepness of the curve.
- Threshold dose: the smallest dose that produces a measurable effect.
Graded dose-response curves
A graded curve shows how the size of an effect in a single tissue or individual rises with dose. The effect might be the contraction of a piece of muscle, the fall in heart rate, or a change in a laboratory measurement. If the drug acts on one receptor and the response is proportional to occupancy, the curve follows the Emax equation, which has the same hyperbolic form as the occupancy law:
E = Emax × C / (EC50 + C)
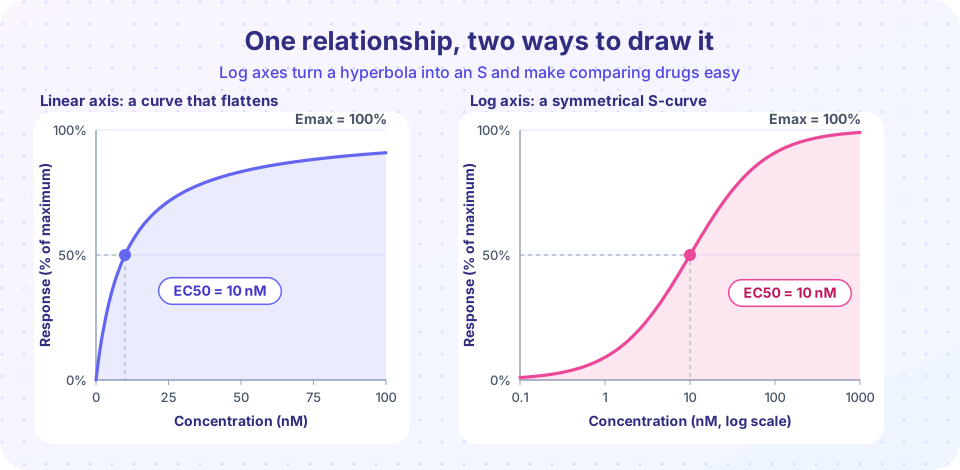
Emax is the maximum possible effect, and EC50 is the concentration giving half of it. Some properties are easy to verify by substitution. At C = EC50, E = Emax / 2. At C = 9 × EC50, E = 0.9 × Emax. At C = EC50 / 9, E = 0.1 × Emax. So the effect rises from 10% to 90% over an 81-fold range of concentration. On a plain linear axis, this looks like a curve that rises quickly and then flattens, and it is hard to read the low end.
Plotting concentration on a logarithmic axis turns the hyperbola into a symmetrical S-shaped (sigmoid) curve, with the EC50 at the midpoint. It spreads out the low doses, compresses the high ones, and makes the curves of different drugs easy to compare: potent drugs sit further left, and a competitive antagonist shifts the curve to the right without changing its shape (Chapter 2). The central part of the S is nearly straight, which is why it is used to estimate an EC50 by eye.
The Hill equation and steepness
Many real curves are steeper or shallower than the simple form. Archibald Hill introduced an exponent to describe cooperative binding of oxygen to haemoglobin, and the same idea is used for drugs:
E = Emax × C^n / (EC50^n + C^n)
n is the Hill slope. With n = 1 you recover the Emax equation. If n > 1, the curve is steeper: effect switches from low to high over a narrower range of concentration, as when several drug molecules must bind to act or when the cell response has an all-or-none step. If n < 1, the curve is flatter. Steep curves matter clinically: a drug with a steep dose-response curve changes from "no effect" to "full effect" over a small change of dose, so there is less room for error.
Spare receptors and the gap between affinity and potency
In some tissues the maximal response occurs when only a fraction of receptors is occupied, because the cell amplifies the signal. The effect curve then lies to the left of the occupancy curve: EC50 is smaller than Kd. The size of the gap depends on the amplification. This is why potency in a tissue is not the same as affinity, and why a partial agonist may appear as a full agonist in a tissue with many spare receptors, but as a partial agonist in a tissue with few. It also explains why an irreversible antagonist first shifts the curve to the right and only later lowers the maximum.
Quantal dose-response curves
A quantal response is all-or-none for each individual: the patient's pain is relieved or not, the animal falls asleep or not, a seizure is stopped or not. To draw the curve, give different doses to groups of subjects and count the percentage that respond at each dose. Individuals differ in sensitivity, so some respond at low doses and others need much more. The thresholds are roughly log-normally distributed: a bell-shaped (normal) distribution on the log-dose axis. The cumulative percentage of responders therefore forms an S-shaped curve. The dose at which 50% respond is the ED50 (effective dose 50); the dose at which 50% show a toxic effect is the TD50; and in animal experiments the dose that kills half is the LD50. These give the therapeutic index in the next lesson.
The two kinds of curve answer different questions:
| Graded | Quantal | |
|---|---|---|
| Measures | Size of effect in one subject or tissue | Fraction of a population responding |
| y axis | Effect (units or % of maximum) | Percent responding |
| Midpoint | EC50 | ED50 |
| Used for | Mechanism, potency, efficacy | Population effects and safety margins |
Time matters too
A dose-response curve is a snapshot at a chosen time. Effects can lag behind concentration, because it takes time for a drug to reach the effect site or to trigger signalling. Some effects also keep growing long after the drug is gone (for example, anticoagulants that deplete clotting factors). When you read a curve, ask: measured when, in whom, and by what end point?
Common misconceptions
- "The top of the curve is the best dose." Beyond the steep region, extra dose adds little benefit and often more side effects. The best dose is usually in the upper part of the steep region, not at the ceiling.
- "EC50 is the dose that works." It is the dose giving half of the maximum effect, and what counts as enough depends on the clinical goal.
- "Quantal curves and graded curves are the same." A quantal curve describes a population's distribution of thresholds, not how strongly a single person responds.
Try it
First, compare curves with Hill slopes of 0.5, 1, 2 and 4 on a log axis. The EC50 is the same (10) for all of them.
Press Run (or Ctrl + Enter) to see the result here.
Program input · what you'd type while the program runs
Type the answers before you press Run, one per line. Each time the program reads a line (with input()), it gets the next line from this box.
Second, estimate EC50, Emax and the Hill slope from noisy synthetic data. This is how an experimenter would analyze a measured curve, and the fit also gives uncertainty estimates.
Press Run (or Ctrl + Enter) to see the result here.
Program input · what you'd type while the program runs
Type the answers before you press Run, one per line. Each time the program reads a line (with input()), it gets the next line from this box.
Third, a curve designer. Move the sliders for EC50, Emax and the Hill slope and watch the S-curve on a log axis.
Check your understanding
Quick check · 5 questions
of 5 answered You scored / 5 · perfect!
-
1. In the Emax model, what concentration gives 90% of Emax?
0.9 = C / (EC50 + C) gives C = 9 x EC50. -
2. Why are dose-response curves usually plotted with a log concentration axis?
A log axis turns the hyperbola into a sigmoid curve and makes shifts and slopes easy to see. -
3. A drug has a Hill slope of 4. Compared with a slope of 1, the curve is
A higher n means a narrower range of concentration between low and high effect. -
4. Which is a quantal response?
Quantal responses are all-or-none for each individual and are counted as a percentage of the group. -
5. In a tissue with spare receptors, the EC50 is typically
The response saturates before occupancy, so the effect curve lies to the left of the binding curve.
Summary
- Graded curves show effect size in one tissue; quantal curves show the fraction of a population responding.
- The Emax equation E = Emax x C / (EC50 + C) is a hyperbola; on a log axis it is a symmetrical S-curve.
- The Hill slope describes steepness; steep curves leave less room for error.
- Spare receptors make EC50 smaller than Kd; EC50, Emax and slope can be fitted from data.
Track your progress
Create a free account to tick off lessons and pick up where you left off on any device.
of Pharmacology lessons completed