


















Lesson 2 of 48 · Getting Started
Weather versus climate
Learn the difference between weather and climate, why 30-year averages matter, how variability hides trends, and why one cold day tells you little about climate.
Everyone talks about the weather. It decides what you wear this morning, whether the match is played and whether the washing dries. Climate is a different kind of thing. It is not what is happening outside the window; it is the pattern that a place settles into when you watch it for many years. Getting this difference clear is the first step in climate science, because almost every argument that goes wrong in public discussion goes wrong here.
This lesson defines both ideas, explains why the standard averaging period is thirty years, shows how large day-to-day variation can hide a slow trend, and explains why a snowstorm does not disprove warming (and a heat wave does not prove it).
What you will learn
- Define weather and climate and say which time scales belong to each.
- Explain why climate normals use 30 years of data.
- Describe signal, noise and natural variability in a temperature record.
- Explain why single events cannot prove or disprove a climate trend.
- Calculate how averaging reduces random scatter.
Key terms
Weather: the state of the atmosphere at a particular place and time (temperature, wind, cloud, rain). Climate: the statistical description of weather over a long period: its mean, its spread and its extremes. Climate normal: a 30-year average used as a reference (the current World Meteorological Organization standard period is 1991 to 2020). Variability: natural ups and downs around the average. Signal and noise: the slow change you care about, and the scatter that hides it.
Weather: hours to weeks
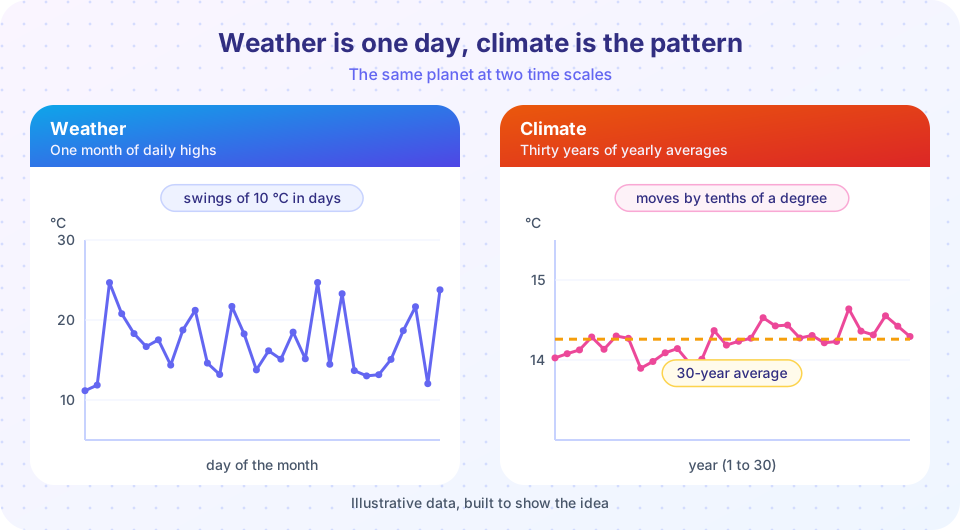
Weather is what the atmosphere does over hours, days and a few weeks. A cold front arrives, the pressure falls, a storm crosses the region and clears. Weather changes constantly because the atmosphere is a fluid heated unevenly, stirred by Earth's rotation, and full of instabilities that grow rapidly.
That growth of small differences is the reason weather forecasts have a horizon. In 1961 the meteorologist Edward Lorenz was rerunning a simple computer model of the atmosphere and entered a starting value rounded from six digits to three. The new run drifted away from the old one until it looked like a completely different forecast. His 1963 paper on this sensitive dependence on initial conditions is the origin of what is popularly called the butterfly effect. In practice, detailed forecasts of individual weather systems lose skill after about one to two weeks, however good the model and the data.
Climate: the statistics of weather
Climate is not the sequence of days but the distribution of them. If you collected the daily high temperature for a city for every 15 July in thirty years, you would get thirty numbers. Their average, their typical spread and the hottest and coldest values are the climate of that date. The same idea extends to rainfall, wind, snow depth, humidity and the number of frost days.
This is why meteorologists and climate scientists talk about two different questions. Weather asks "what will happen on Tuesday?". Climate asks "what is typical for July here, and how often do extremes occur?". The Intergovernmental Panel on Climate Change defines climate more broadly as the average weather, or statistically the mean and variability of relevant quantities, over periods that range from months to thousands or millions of years. The classical averaging period is 30 years.
Why 30 years?
Thirty is a compromise, agreed on internationally in the early 20th century and kept ever since. It is long enough to smooth out most year-to-year swings, including El Niño and La Niña (irregular warming and cooling of the tropical Pacific that alter weather worldwide every two to seven years). It is short enough to be useful: you still get a fresh, relevant "normal" every decade as the data grows. A 30-year window is not a law of nature. Some questions need longer (rare floods) and some shorter (the last ten years' trend).
Signal and noise
Imagine measuring the average temperature of one summer each year for thirty years. The numbers jump up and down by a degree or so. Hidden under the jumps, the climate may be shifting by 0.02 °C each year. The slow shift is the signal. The random year-to-year scatter is the noise (scientists often say natural variability). To see a signal you need enough data that it climbs clear of the noise.
Averaging is the basic tool. If each year's value contains independent random scatter with standard deviation σ, the average of n years has scatter of about σ / √n. Ten years cut the scatter to about a third; thirty years to about a fifth. Doubling the precision costs four times the data. That square-root law is why a trend needs a minimum record length before you can trust it, and why short ten-year wiggles are poor evidence either way.
Worked example: how much does averaging help?
A coastal station has yearly mean temperatures that scatter with σ = 0.6 °C around a steady climate. How uncertain is a 30-year average? 0.6 / √30 = 0.6 / 5.48 ≈ 0.11 °C. A 10-year average has 0.6 / √10 ≈ 0.19 °C. So a 0.3 °C difference between two 30-year normals is more than two standard errors apart and is likely to be real, whereas a 0.3 °C difference between two single years is well within the noise.
One cold day proves nothing
The standard mistake is to treat one weather event as evidence about climate. A record-breaking cold snap in January shows only that weather can be extreme. Climate change shifts the whole distribution, so on average there are more hot extremes and fewer cold ones, but cold days do not vanish. The reverse is just as true: a single heat wave is weather, although a pattern of more frequent and stronger heat waves over decades is climate.
A useful mental picture is a bell curve of daily temperatures. Slide the whole curve a little to the right and the hot tail becomes much fatter, while the cold tail becomes thinner but does not disappear. Extremes change faster, in relative terms, than averages. For this reason scientists examine frequencies and probabilities of extreme events rather than arguing about any one of them.
Common misconceptions
"It snowed today, so global warming is a myth." One day in one place is weather. Global warming is a change in the average over the whole planet and over decades. Cold spells remain possible in a warmer world.
"Forecasters cannot predict next week, so they cannot predict 2100." Both are predictions, but they ask different questions. Weather forecasts need the exact state of the atmosphere on a given day; climate projections ask how the averages respond to changes in energy. Compare a single dice roll, which is unpredictable, with the average of a thousand rolls, which is highly predictable.
"The climate has always changed, so the current change is natural." True that it has always changed, but each past change had a cause (orbital cycles, volcanoes, changes in the Sun, greenhouse gases). The question is what is causing this one, and chapters 3 and 4 answer it with evidence.
Try it
The first example creates thirty years of invented daily temperatures with a seasonal cycle, random weather and a small warming trend. It then separates the two layers: the weather on one date, and the climate (the 30-year average for that date). All the data are simulated, built to show the idea.
Press Run (or Ctrl + Enter) to see the result here.
Program input · what you'd type while the program runs
Type the answers before you press Run, one per line. Each time the program reads a line (with input()), it gets the next line from this box.
The second example is interactive. Drag the slider to widen the averaging window and watch the noise fade while the slow trend survives. The data are simulated.
The third example checks the square-root rule by simulation. It draws many random 30-year records and compares the scatter of their averages with σ / √n.
Press Run (or Ctrl + Enter) to see the result here.
Program input · what you'd type while the program runs
Type the answers before you press Run, one per line. Each time the program reads a line (with input()), it gets the next line from this box.
Check your understanding
Quick check · 5 questions
of 5 answered You scored / 5 · perfect!
-
1. Which statement is about climate rather than weather?
Only the second statement describes a long-term pattern. The others refer to one day or a forecast, which is weather. -
2. Why do climate scientists use 30-year averages?
The 30-year period is a convention: long enough to average out typical natural variability, short enough to be updated regularly. -
3. Yearly temperatures scatter with a standard deviation of 0.8 °C. About how uncertain is a 16-year average?
Scatter of an average is sigma divided by the square root of n: 0.8 / 4 = 0.2 °C. -
4. A record cold day occurs in a region. What can you conclude about long-term warming?
A single extreme day tells you only that weather varies. Trends need decades of data. -
5. What did Edward Lorenz's experiments show about weather forecasting?
Sensitive dependence on initial conditions limits forecast range, but it does not prevent predicting long-term averages.
Summary
- Weather is the state of the atmosphere over hours to weeks. Climate is the statistics of weather (mean, spread and extremes) over decades.
- The standard averaging period is 30 years; the current normal period is 1991 to 2020.
- A trend is a signal inside natural variability. Averaging
nindependent values reduces random scatter by√n. - Single events, hot or cold, are weather. Changes in frequency and intensity of events over decades are climate.
- Forecasting a particular storm and projecting long-term averages are different problems.
Next: Anomalies and baselines
Track your progress
Create a free account to tick off lessons and pick up where you left off on any device.
of Climate Science lessons completed