


















Lesson 21 of 48 · Climate Records and Proxies
Tree rings, corals and sediments
Learn how scientists read past climate from tree rings, corals, ocean sediments and cave deposits: cross-dating, Sr/Ca and oxygen isotopes, foraminifera, and how proxies are calibrated.
Ice cores are a spectacular archive, but they exist only where ice is thick. Most of the planet is covered by forests, tropical seas and ocean floors, and these have their own diaries. A tree grows a layer each year. A coral builds a skeleton from seawater and records its temperature and salinity in the chemistry. A speck of ocean mud contains the microscopic shells of animals that lived at the surface and fell to the bottom when they died. Read together, these records extend the thermometer record back through centuries and millennia, to millions of years.
In this lesson you meet the main proxy types, learn how each is dated and how it is calibrated, and see how scientists combine them in multi-proxy reconstructions. The common theme is that a good proxy is a physical process with a known response to climate, not a guess.
What you will learn
- Explain how tree rings are cross-dated and what ring width and density record.
- Describe how coral chemistry (Sr/Ca and oxygen isotopes) records sea temperature.
- Explain how foraminifera shells in ocean sediments reveal ice volume and temperature over millions of years.
- Describe other proxies: cave deposits, pollen, lake sediments and historical documents.
- Explain how multi-proxy reconstructions are built and checked.
Key terms
Dendrochronology: dating and studying tree rings. Cross-dating: matching ring patterns among trees to assign an exact calendar year to each ring. Foraminifera: single-celled marine organisms that build calcium carbonate shells. Speleothem: a cave deposit such as a stalagmite. Multi-proxy reconstruction: a climate history built by combining many proxy records. Divergence: a period when a proxy stops following the climate variable it was calibrated against.
Tree rings
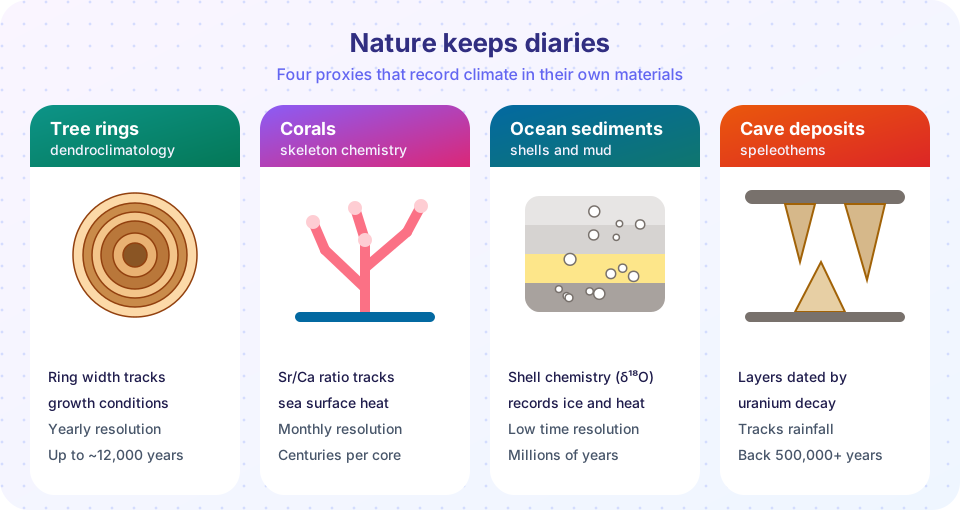
In places with a strong seasonal cycle, a tree adds a ring of new wood every year: large pale cells in spring and early summer, small dark cells late in the season. The thickness of the ring depends on how much the tree grew, and growth depends on the weather. At high latitudes and high altitudes, near the tree line, summer warmth limits growth, so wide rings mean warm summers and the density of the late wood is an even better thermometer. In dry regions, such as the American Southwest, rainfall limits growth, and rings record drought.
Cross-dating is the central trick. Because the same weather hits all the trees in a region, they share a pattern of wide and narrow rings. By matching the sequence of a living tree to older timber from buildings, beams and preserved logs, researchers extend the record year by year back far beyond the life of any one tree. The pioneer was the American astronomer Andrew Ellicott Douglass, who in the early 1900s used rings to link tree growth to sunspot cycles. Today continuous oak and pine chronologies in central Europe reach back about 12,000 years, and the oldest individual living trees, bristlecone pines in California, are nearly 5,000 years old.
Tree rings have limits. Trees also respond to competition, pests, fire and soil, so scientists remove the slow age-related trend in ring width (it gets narrower as a tree grows) and use many trees per site. One known problem is the "divergence" noted in some high-latitude sites since about the 1960s, where the rings no longer follow the warming seen by thermometers as closely as they did before. Researchers study the causes (drought stress, changes in daylight and pollution are among the candidates) and avoid relying on records that diverge.
Corals
Massive corals such as Porites grow a few centimeters a year, adding a skeleton of calcium carbonate with annual density bands visible in X-rays. The skeleton contains traces of strontium. The ratio of strontium to calcium (Sr/Ca) falls as the water warms, by about 0.06 mmol/mol per degree Celsius, which makes it a good thermometer of sea surface temperature. The oxygen isotope ratio (δ¹⁸O) in coral also decreases with warming, by about 0.2 ‰ per °C, but it also depends on the salinity and seawater composition, so scientists often use the two together to separate temperature from rainfall.
A single core of a few meters can give monthly resolution for several centuries. Cores from the tropical Pacific record El Niño events for hundreds of years, and fossil corals, dated by uranium-thorium decay, document earlier periods. Corals also grow near the sea surface and are lifted or submerged when sea level changes, so dated fossil corals from Barbados and other sites trace the sea-level rise since the last ice age (about 120 m in 10,000 years).
Ocean sediments
Every year, tiny shells and particles settle to the sea floor at rates of a few millimeters per thousand years in the deep ocean and several centimeters in coastal basins, building layers of mud. The sediments hold shells of foraminifera, with their chemistry recording the conditions in which they grew.
The oxygen isotope ratio δ¹⁸O of foraminiferal shells responds to two things. One is the temperature of the water when the shell formed (calcite takes up slightly more ¹⁸O in cold water, about 0.23 ‰ per degree). The other is the isotopic composition of the seawater, which changes when ice sheets grow. Ice is isotopically light (it is made of snow that is depleted in ¹⁸O), so when the ice sheets grow, the ocean left behind becomes heavier. Therefore shells from the ice ages have higher δ¹⁸O, for two reasons: colder water and more ice. For deep-sea shells, roughly half to two-thirds of the glacial-interglacial change of about 1.8 ‰ is due to ice volume (about 1.0 to 1.2 ‰ for a sea level drop of about 120 m), and the rest to cooling of the deep water.
Compilations of dozens of sediment cores (such as the LR04 stack by Lisiecki and Raymo in 2005) give a continuous history of ice ages over the past 5 million years. Other sediment tracers add information: magnesium to calcium ratios (Mg/Ca) in foraminifera shells give temperature directly, and organic molecules from algae (alkenones) record sea surface temperature. Dating uses radiocarbon back to about 50,000 years, then known magnetic reversals (the last major reversal was about 773,000 years ago), and finally the match of cycles to the known orbital variations (lesson 5). Because burrowing animals mix the top centimeters of the sediment, the time resolution in the deep sea is usually centuries to millennia, much coarser than in tree rings or corals.
Other archives
- Speleothems (stalagmites) grow layer by layer from dripping water. The oxygen isotopes record rainfall patterns and they can be dated very precisely by uranium-thorium decay, back to several hundred thousand years, so they are used to date events recorded elsewhere.
- Pollen and lake sediments record vegetation, which depends on temperature and moisture. Seasonal layers (varves) in some lakes give yearly resolution.
- Glaciers leave moraines that mark how far they advanced; dating them gives the timing of cold periods.
- Boreholes retain a memory of past surface temperatures in the heat distribution of the ground.
- Historical documents such as grape harvest dates, records of river freezing, cherry-blossom festivals in Kyoto (kept since the ninth century) and ships' logs supply direct observations from before thermometers.
Putting proxies together
No single proxy is perfect, so the best reconstructions combine many. A reconstruction is built in several steps: choose proxies with a known relationship with temperature, calibrate them against thermometer data in the 20th century, test them in a separate period (verification), and combine them into regional or global averages with uncertainty ranges. In 1998 and 1999 Michael Mann, Raymond Bradley and Malcolm Hughes published the first reconstruction of Northern Hemisphere temperature over the past 600 to 1,000 years, whose shape (slow cooling, then a sharp rise in the 20th century) was nicknamed the hockey stick. It was scrutinized intensively; the US National Research Council reviewed it in 2006 and supported the main conclusion for the last 400 years, and the later PAGES 2k Consortium (2019), using a much larger collection of records and several methods, again found that recent warming is unusual in the context of the last 2,000 years. Differences between reconstructions concern details and uncertainty (for example the size of the medieval and Little Ice Age variations), not the conclusion that the late 20th century was exceptionally warm.
Common misconceptions
"Proxy temperature is guessed." It is calibrated and tested against instrumental records, and checked against other independent proxies. Uncertainties are reported.
"The divergence problem means tree rings are useless." It means some trees at some sites stopped being good thermometers after about 1960. Researchers study them, exclude affected records and cross-check against corals, ice cores and others.
"A medieval warm period was as warm as today everywhere." Medieval warmth was regional and uneven, and global reconstructions put it below present levels. The IPCC finds that the recent decade is warmer than any multi-century period in at least 6,500 years.
Try it
The first example shows cross-dating. A tree of unknown age ("floating") has only its ring widths, but it shares year-to-year weather with a master chronology. Sliding it along the master chronology reveals the calendar year at which they match best.
Press Run (or Ctrl + Enter) to see the result here.
Program input · what you'd type while the program runs
Type the answers before you press Run, one per line. Each time the program reads a line (with input()), it gets the next line from this box.
The second example separates ice volume from temperature in a foraminifera δ¹⁸O record, using round numbers.
Press Run (or Ctrl + Enter) to see the result here.
Program input · what you'd type while the program runs
Type the answers before you press Run, one per line. Each time the program reads a line (with input()), it gets the next line from this box.
The third example lets you play tree. Pick how strongly ring width follows temperature and how much other noise there is, then see how well the rings can be read as a thermometer.
Check your understanding
Quick check · 6 questions
of 6 answered You scored / 6 · perfect!
-
1. What is cross-dating?
Shared year-to-year weather leaves similar wide and narrow rings across a region, allowing exact matching. -
2. How does the strontium-to-calcium ratio in coral skeleton respond to warming?
Sr/Ca decreases as the water warms, so it works as a sea-surface thermometer. -
3. Why are foraminifera shells from ice-age sediments richer in oxygen-18?
Both cooler water and ice volume raise shell δ¹⁸O. -
4. Which proxy has the finest (monthly) time resolution of those listed?
Coral cores can resolve seasons, while deep-sea sediments resolve centuries to millennia. -
5. What does a clear single best match in a cross-dating test imply?
A distinct peak in correlation at one lag identifies the calendar date with confidence. -
6. What have multi-proxy reconstructions such as PAGES 2k concluded?
Using many records and methods, PAGES 2k and the IPCC find that recent decades are exceptionally warm.
Summary
- Tree rings give yearly records, cross-dated to the exact year; they respond to temperature or moisture depending on site.
- Corals record sea temperature through Sr/Ca and δ¹⁸O at monthly resolution; sediments record ice volume and temperature over millions of years.
- Speleothems, pollen, lake varves, glaciers and historical documents add independent checks.
- Proxies must be calibrated and verified; multi-proxy reconstructions combine them with uncertainty ranges.
- Independent archives agree that the late 20th and early 21st centuries are warm beyond the last 2,000 years.
Track your progress
Create a free account to tick off lessons and pick up where you left off on any device.
of Climate Science lessons completed