


















Lesson 4 of 48 · Getting Started
A short history of climate science
Trace how climate science developed over two centuries, from Fourier and Tyndall to Arrhenius, Keeling, early models and the IPCC, and see how the ideas built on each other.
The idea that human activities might change the climate is not new, and it did not begin with a political movement. It grew out of curiosity about the physics of heat, light and gases, pursued over two centuries by people who were often answering other questions. Physicists studying heat, chemists measuring gases, oceanographers puzzling over the sea and meteorologists building the first computer models each added a piece.
Knowing this history is useful for two reasons. First, it shows that the basic physics is old and has been checked many times from different directions. Second, it shows how scientific understanding actually advances: by measurements, objections, corrections and better instruments, not by a single decisive experiment.
What you will learn
- Name the main scientists and discoveries from Fourier to the IPCC.
- Explain how each step built on earlier work.
- Describe how estimates of climate sensitivity changed and why they stayed within a range.
- Recognize and answer the "1970s global cooling" misconception.
Key terms
Greenhouse effect: warming of a planet's surface because its atmosphere absorbs outgoing heat radiation. Climate sensitivity: the warming that results from a doubling of atmospheric carbon dioxide. Keeling curve: the continuous record of carbon dioxide at Mauna Loa, Hawaii, begun in 1958. IPCC: the Intergovernmental Panel on Climate Change, which assesses published climate science. Radiative forcing: a change in Earth's energy balance (in W/m²) caused by something such as more greenhouse gases.
1820s: Fourier asks why Earth is warm
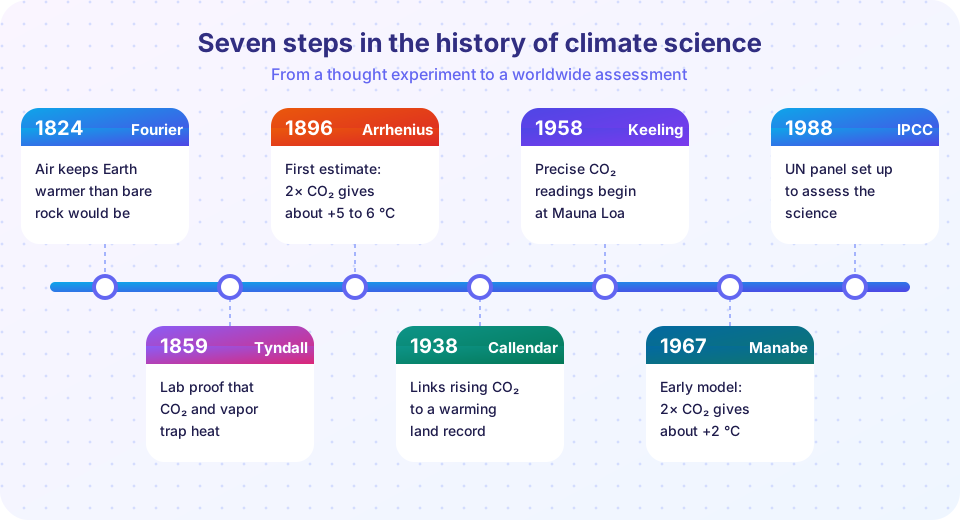
In the early 1800s the French mathematician Joseph Fourier worked on how heat flows through solids. Turning to the planet, he asked a neat question: if Earth sat in space and was warmed only by the Sun, would its temperature be what we observe? Estimating the incoming heat and what a bare surface would radiate, he concluded that the surface should be colder than it is, and suggested that the atmosphere acts somewhat like the glass of a hot box (an experiment by Horace-Bénédict de Saussure, who had measured temperatures inside glass-covered boxes in the Alps). Fourier's papers of 1824 and 1827 did not identify any gas; they posed the problem.
1850s: laboratory proof
In 1856 the American scientist Eunice Foote put glass cylinders filled with different gases in sunlight and noted that the cylinder with carbon dioxide warmed more and stayed warm longer. Her work was presented at a scientific meeting that year (by another man, as was common then) and was forgotten for a long time. In 1859 the Irish physicist John Tyndall built a sensitive apparatus to measure how well gases absorb and emit heat radiation. He found that the main gases of the air, nitrogen and oxygen, are nearly transparent to infrared radiation, while water vapor, carbon dioxide, methane and ozone absorb it strongly. This was the decisive laboratory fact: tiny amounts of certain gases can control the passage of heat.
1896: Arrhenius does the sums
The Swedish chemist Svante Arrhenius took Tyndall's absorption data and, by hand and over many months, calculated how the surface temperature would respond if the amount of carbon dioxide changed. His 1896 paper concluded that doubling the gas would warm the world by roughly 5 to 6 °C (and that cutting it would cool the world by a similar order). Arrhenius expected humans to add CO₂ only slowly (he guessed thousands of years for a doubling), and he welcomed the idea of a warmer, more productive climate. The method, including the logarithmic dependence on concentration, still stands; the number later turned out to be too large, as better data on absorption and on other feedbacks came in.
In 1900 the Swedish physicist Knut Ångström reported experiments suggesting that the absorption by CO₂ was already "saturated", so adding more would change little. For decades this objection slowed acceptance. It was resolved in the 1940s to 1960s with better spectroscopy and an understanding of how the atmosphere thins with altitude: radiation escapes to space from a high, cold layer, and adding gas raises that layer even if the lower atmosphere is already opaque. Chapter 3 explains this.
1938 to 1958: measuring the rise
In 1938 the British engineer Guy Stewart Callendar collected records and argued that carbon dioxide had risen by about 10 % since the late nineteenth century and that land temperatures had warmed too. He thought the two were linked. Most scientists were doubtful because the oceans seemed able to absorb all human emissions.
In 1957 Roger Revelle and Hans Suess showed that ocean chemistry limits how much carbon the surface water can take up, so a significant part of the added CO₂ must remain in the air. They described what humanity was doing as a large-scale geophysical experiment. The decisive step came from Charles David Keeling, who in 1958 began continuous, highly accurate measurements of atmospheric CO₂ at Mauna Loa, Hawaii, far from local sources. Within a few years the record showed two things at once: a regular up-and-down every year, as plants in the northern hemisphere take up and release carbon, and a steady rise year after year. The data are known as the Keeling curve.
1960s to 1980s: the first models
Syukuro Manabe and Richard Wetherald published in 1967 the first reliable calculation of how the atmosphere responds to more CO₂ using a one-dimensional model that included convection and water vapor feedback. They found that doubling CO₂ would raise the global surface temperature by roughly 2 °C. Three-dimensional general circulation models followed in the 1970s and 1980s. In 1979 a panel chaired by Jule Charney of the US National Academy of Sciences compared the available models and gave a range for climate sensitivity of 1.5 to 4.5 °C per doubling of CO₂, with a best guess near 3 °C. Remarkably, the central estimate has hardly moved since.
Meanwhile ice cores from Greenland and Antarctica started to reveal climate and carbon dioxide over hundreds of thousands of years (chapter 4), and in the 1980s global temperature datasets showed that the warming Callendar had suspected was real and accelerating.
1988 and after: assessments and agreements
In 1988 the World Meteorological Organization and the United Nations Environment Programme set up the Intergovernmental Panel on Climate Change. The IPCC does not carry out research. Its authors review the published literature and write assessment reports (the first in 1990; the sixth between 2021 and 2023), each of which passes through expert and government review. The same year, the NASA scientist James Hansen testified to the US Senate that the evidence for warming was strong. The UN Framework Convention on Climate Change followed in 1992, the Kyoto Protocol in 1997 and the Paris Agreement in 2015 (chapter 8 covers these).
How estimates of sensitivity changed
The history of sensitivity estimates is revealing. From Manabe's first model to the latest IPCC assessment, results have stayed within a band of about 2 to 5 °C per doubling, even though the methods have changed from hand calculation to supercomputers and paleoclimate analysis. In the sixth assessment (2021) the best estimate is 3 °C, with a likely range of 2.5 to 4 °C. The central value is stable because it comes from physics that has been checked many times, and the range has narrowed because independent lines of evidence now agree.
Common misconceptions
"In the 1970s scientists predicted a new ice age." A few media stories said so, and a small number of papers examined cooling from industrial aerosols. A review of the scientific literature from 1965 to 1979 (Peterson, Connolley and Fleck, 2008) found that far more papers predicted warming than cooling. Even then the concern about CO₂ was growing.
"Climate science is a new, political invention." The core physics was established in the nineteenth century, long before public debate. Arrhenius's calculation dates from 1896, and the warming effect of CO₂ was demonstrated in the lab by Foote and Tyndall.
"One person or one study 'discovered' global warming." Each step above depended on earlier work and on independent confirmation. No single result stands alone.
Try it
The first example compares historical estimates of how much warming follows a doubling of CO₂. Notice how stable the central values are.
Press Run (or Ctrl + Enter) to see the result here.
Program input · what you'd type while the program runs
Type the answers before you press Run, one per line. Each time the program reads a line (with input()), it gets the next line from this box.
The second example is a small memory aid. Click a milestone to read its story and what it contributed.
The third example turns the Keeling record into growth rates. The values are rounded annual means of carbon dioxide, so the rates are approximate.
Press Run (or Ctrl + Enter) to see the result here.
Program input · what you'd type while the program runs
Type the answers before you press Run, one per line. Each time the program reads a line (with input()), it gets the next line from this box.
Check your understanding
Quick check · 5 questions
of 5 answered You scored / 5 · perfect!
-
1. Which scientist measured in 1859 that nitrogen and oxygen barely absorb infrared radiation while water vapor and carbon dioxide absorb it strongly?
Tyndall's laboratory measurements showed that trace gases such as CO₂ and water vapor control the passage of heat radiation. -
2. What did Charles David Keeling's measurements at Mauna Loa show?
The Keeling curve combines a seasonal cycle from plant growth with a persistent rise caused mainly by fossil-fuel burning. -
3. How has the central estimate of climate sensitivity changed from the 1979 Charney report to the 2021 IPCC report?
Both give about 3 °C as the best estimate, although the 2021 report narrowed the range to 2.5 to 4 °C (likely). -
4. Does the IPCC carry out its own research?
The IPCC reviews and assesses the published literature; its reports are reviewed by experts and governments. -
5. A review of the 1965-1979 scientific literature found that most papers on climate predicted:
Peterson, Connolley and Fleck (2008) found that warming predictions greatly outnumbered cooling predictions, contrary to the 'ice age' myth.
Summary
- Fourier (1820s) posed the puzzle; Foote and Tyndall (1850s) showed that CO₂ and water vapor absorb heat radiation.
- Arrhenius (1896) calculated the warming from doubled CO₂; objections about saturation were resolved by the middle of the twentieth century.
- Callendar, Revelle and Suess, and above all Keeling (1958) established that CO₂ was rising.
- The first realistic models (Manabe and Wetherald 1967, Charney 1979) gave about 3 °C per doubling, a figure that has remained stable.
- The IPCC (1988) reviews the published evidence for governments.
Next: Review: Getting Started
Track your progress
Create a free account to tick off lessons and pick up where you left off on any device.
of Climate Science lessons completed