


















Lesson 30 of 48 · Impacts and Risks
Sea level and ice
Find out why the sea is rising, how much water ice sheets and glaciers hold, what the IPCC projects, and why sea level keeps rising for centuries.
Sea level is the most patient of climate indicators. Air temperature wobbles from year to year, but the ocean keeps absorbing heat and the ice keeps melting, so sea level climbs steadily and, as the rate shows, faster than before. Because the ocean and the ice sheets are slow to respond, the sea level you see in 2100 will already be set partly by the warming of the next few decades, and it will keep rising for centuries after that.
In this lesson you will see where the extra water comes from, do the arithmetic that links ice to millimeters, read the IPCC's projections, and understand why a rise of a meter has consequences far beyond "a little more water."
What you will learn
- Name the contributions to sea level rise and their relative size.
- Convert gigatonnes of ice into millimeters of sea level.
- Quote the observed rise and AR6 projections with their conditions.
- Explain commitment, ice sheet instability and regional differences.
Key terms
Global mean sea level (GMSL): the average height of the ocean surface. Thermal expansion: water expands as it warms. Sea level equivalent (SLE): the sea level rise if a given mass of ice melted completely and spread over the ocean. Mass balance: the gain (snowfall) minus the loss (melt, calving) of an ice mass. Relative sea level: the sea level measured against the local land, which also moves up or down.
Where the extra water comes from
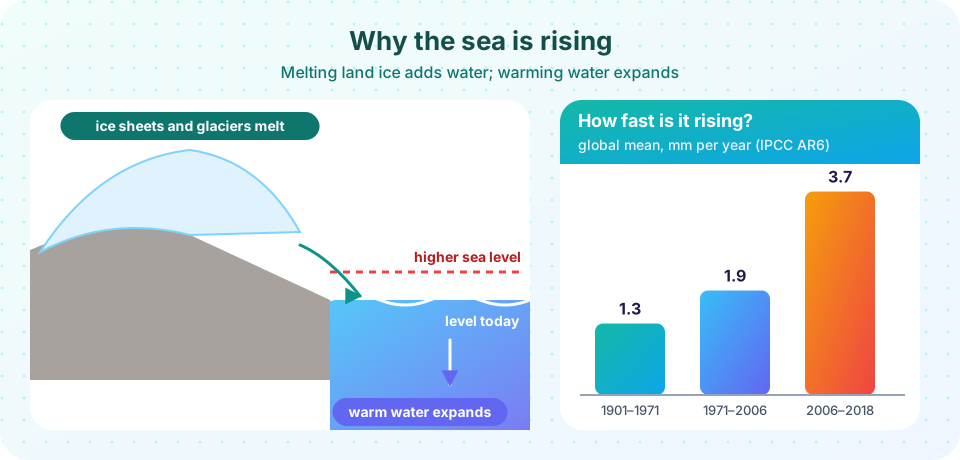
Sea level goes up in two ways. Either the same amount of water takes up more space, or more water arrives. Both are happening.
- Thermal expansion. Seawater expands slightly as it warms (about 0.02% in volume per kelvin near typical ocean temperatures, more in warm water than in cold). The ocean has absorbed over 90% of the extra heat trapped by greenhouse gases, so this effect is substantial. In recent decades it has accounted for roughly a third to a half of the rise.
- Mountain glaciers. Glaciers outside the two big ice sheets retreat as they melt. They hold only a little ice, about 0.3 to 0.4 m of potential sea level, but they respond quickly and have been a leading contributor.
- The Greenland Ice Sheet. It contains enough ice for about 7 m of sea level. It has been losing mass since the 1990s, on the order of a few hundred gigatonnes of ice per year in recent decades, through surface melt and ice flowing into the sea.
- The Antarctic Ice Sheet. It holds about 58 m of sea level equivalent, most of it in East Antarctica (around 53 m). West Antarctica holds about 3 to 4 m and is the part most at risk, because much of its ice rests on bedrock below sea level. Antarctic mass loss has also grown in recent decades.
- Land water storage. Human use of groundwater and reservoirs moves water to the ocean or holds it back; the net effect is small and uncertain.
Floating ice does not raise sea level when it melts. A glass of water with an ice cube does not overflow as the cube melts, because floating ice already displaces its own weight in water. Melting sea ice and floating ice shelves does not directly raise the sea. It is ice on land that adds new water. (Melting sea ice and ice shelves still matters indirectly: shelves hold back the glaciers behind them, and sea ice reflects sunlight.)
Turning ice into millimeters
The ocean covers about 3.61 × 10¹⁴ m², roughly 71% of Earth's surface. One millimeter of sea level over that area is
3.61e14 m² × 0.001 m = 3.61e11 m³ of water ≈ 3.61e11 tonnes ≈ 361 Gt
(One cubic meter of water has a mass of about one tonne.) So about 361 gigatonnes of land ice melting raises global sea level by 1 mm. If the Greenland Ice Sheet loses 270 Gt per year, that alone adds about 270/361 ≈ 0.75 mm per year.
What has been observed
The IPCC's Sixth Assessment Report concluded that global mean sea level rose about 0.20 m (likely 0.15 to 0.25 m) between 1901 and 2018. The rate has accelerated:
| Period | Average rate (mm per year) |
|---|---|
| 1901 to 1971 | 1.3 |
| 1971 to 2006 | 1.9 |
| 2006 to 2018 | 3.7 |
You can check that these rates are consistent with the total: 1.3 × 70 + 1.9 × 35 + 3.7 × 12 ≈ 202 mm. The record combines tide gauges (stations measuring the sea against the land since the 1800s) with satellite altimetry (radar measurements from space since 1993 that give global coverage to a few millimeters of precision).
What is projected
Projections combine models of ocean warming, glacier melt, ice sheet change and land water. AR6 gives likely ranges for global mean sea level in 2100 relative to 1995-2014:
- about 0.28 to 0.55 m under a very low emissions scenario (SSP1-2.6);
- about 0.44 to 0.76 m under a middle scenario (SSP2-4.5);
- about 0.63 to 1.01 m under a very high emissions scenario (SSP5-8.5).
For ice sheets, the physics of rapid disintegration (for example, collapse of tall ice cliffs, or marine ice sheet instability, where a retreating glacier on a downward-sloping bed speeds up) is poorly constrained. AR6 therefore notes that low-likelihood, high-impact outcomes cannot be ruled out: under the highest emissions scenario, global sea level rise approaching 2 m by 2100 and about 5 m by 2150 cannot be excluded.
Committed rise: the long game
Even if warming stops, the deep ocean continues to warm and the ice sheets continue to adjust. The IPCC assessed that, over the next 2000 years, global mean sea level is committed to rise by about 2 to 3 m if warming is limited to 1.5 °C and about 2 to 6 m if limited to 2 °C. Paleoclimate evidence agrees that in past warm periods, such as the last interglacial about 125,000 years ago with temperatures similar to or slightly above today's, sea level stood several meters higher than now.
It is not the same everywhere
Sea level is not a flat bathtub.
- Land moves. Some places sink (subsidence from groundwater pumping, such as in Jakarta and parts of the Mississippi delta), while land in Scandinavia and Canada still rises after the ice age. Relative sea level is what matters for a coast.
- Gravity. A big ice sheet pulls water toward itself. When it shrinks, the sea level falls nearby and rises more than average far away.
- Ocean currents and winds change sea level on regional scales for years to decades.
Why a small rise matters
Coastal floods are caused by surges, tides and waves on top of mean sea level. A rise of a few tens of centimeters raises every flood by the same amount, so events that used to occur once per century can become annual in some places. AR6 estimated that extreme sea level events that were historically rare, about once per century, could occur at least annually at more than half of tide gauge locations by 2100 in all scenarios. Other consequences include saltwater intrusion into groundwater and rivers, erosion, and loss of wetlands and low islands. Hundreds of millions of people live in low-elevation coastal zones, and many large cities sit on deltas.
Common misconceptions
"Melting sea ice is raising the sea." Floating sea ice has little direct effect on sea level; melting ice sheets and glaciers on land do.
"The sea rises evenly." Regional sea level differs because of land movement, gravity, currents and winds.
"If we stop emissions, the sea stops rising." Warming and sea level respond with delays. Even in low scenarios, the ocean keeps rising for centuries, which is why limiting the amount matters.
Try it
First, a converter between ice mass and sea level, using the arithmetic from this lesson. Edit the loss rates to see the contributions.
Press Run (or Ctrl + Enter) to see the result here.
Program input · what you'd type while the program runs
Type the answers before you press Run, one per line. Each time the program reads a line (with input()), it gets the next line from this box.
Second, reconstruct the 20th-century rise from the three AR6 rates and plot the accelerating curve.
Press Run (or Ctrl + Enter) to see the result here.
Program input · what you'd type while the program runs
Type the answers before you press Run, one per line. Each time the program reads a line (with input()), it gets the next line from this box.
Third, a thermal expansion estimate. This is a back-of-the-envelope calculation with an assumed expansion coefficient and warmed layer, not a measurement.
Press Run (or Ctrl + Enter) to see the result here.
Program input · what you'd type while the program runs
Type the answers before you press Run, one per line. Each time the program reads a line (with input()), it gets the next line from this box.
Check your understanding
Quick check · 5 questions
of 5 answered You scored / 5 · perfect!
-
1. Which melting ice raises sea level?
Floating ice already displaces its own weight. Land ice adds new water to the ocean. -
2. About how many gigatonnes of land ice raise global sea level by 1 mm?
The ocean area is 3.61e14 m², so 1 mm is 3.61e11 m³, about 361 Gt of water. -
3. AR6 says global sea level rose about how much from 1901 to 2018?
About 0.20 m (likely 0.15 to 0.25 m), with the rate rising from 1.3 to 3.7 mm per year. -
4. Which ice sheet holds the most sea level equivalent?
Antarctica holds about 58 m of sea level equivalent, much more than Greenland's roughly 7 m. -
5. Why do scientists say sea level is 'committed' to rise for centuries?
Heat takes centuries to mix into the deep ocean and the ice sheets adjust slowly, so rise continues after temperature stabilizes.
Summary
- Sea level rises from thermal expansion and from added water from melting land ice.
- About 361 Gt of land ice equals 1 mm of sea level.
- Observed rise of about 0.20 m from 1901 to 2018 has accelerated from 1.3 to 3.7 mm per year.
- AR6 likely ranges for 2100 are about 0.28 to 0.55 m (SSP1-2.6) and 0.63 to 1.01 m (SSP5-8.5), with low-likelihood higher outcomes.
- Sea level keeps rising for centuries, and it varies regionally.
Next: Heat, water and extremes
Track your progress
Create a free account to tick off lessons and pick up where you left off on any device.
of Climate Science lessons completed