


















Lesson 41 of 48 · Policy and Communication
Communicating climate science
Learn how scientists express certainty, what the consensus studies found, how misinformation works and how to correct it, and how to read climate charts honestly.
You can have the best science in the world and still fail to inform anyone. Climate change is a topic where communication is unusually hard: the evidence is complex, the timescales are long, the stakes touch money, identity and politics, and organized efforts have worked to cast doubt on the science. At the same time, the public wants answers, and many people feel anxious or confused.
This lesson gives you tools for the other half of climate literacy. You will learn how scientists communicate certainty, what studies of expert agreement actually found, the five recurring techniques of climate misinformation, how to respond without making things worse, and how to read (and draw) climate charts honestly.
What you will learn
- Read IPCC confidence and likelihood language correctly.
- Report what consensus studies found, and what they measure.
- Identify the five common techniques of science denial (FLICC).
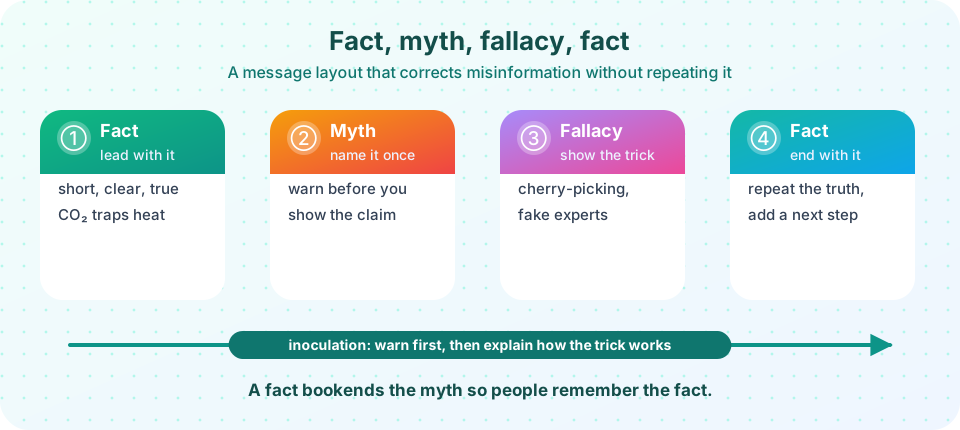
- Apply inoculation and the fact-myth-fallacy-fact structure.
- Spot misleading charts and cherry-picked time windows.
Key terms
Consensus: the degree to which experts agree after reviewing the evidence. Misinformation: false or misleading information spread regardless of intent; disinformation is spread deliberately. FLICC: Fake experts, Logical fallacies, Impossible expectations, Cherry-picking, Conspiracy theories. Inoculation: warning people about misleading techniques before they meet them. Framing: the way a message selects and emphasizes aspects of an issue.
How scientists express certainty
The IPCC uses two scales. Confidence (very low, low, medium, high, very high) reflects the type, amount, quality and consistency of the evidence and the degree of agreement. Likelihood is a calibrated probability: virtually certain (99 to 100%), extremely likely (95 to 100%), very likely (90 to 100%), likely (66 to 100%), about as likely as not (33 to 66%), unlikely (0 to 33%), very unlikely (0 to 10%) and so on. These are defined terms, so "likely" in an IPCC report does not mean "possibly." The practice protects against two errors: overstating certainty and burying a strong conclusion in vague language.
Strong claims are written plainly. The IPCC's Sixth Assessment Report states that it is "unequivocal that human influence has warmed the atmosphere, ocean and land." The language is strong because the evidence is: multiple independent lines (temperature records, ocean heat, ice loss, sea level, fingerprints such as a cooling stratosphere and nights warming faster) point the same way.
What the consensus studies found
Several studies have measured agreement among experts, using different methods.
- Doran and Zimmerman (2009) surveyed earth scientists and found that among those who actively published climate research, 97% agreed that human activity is a significant contributing factor in changing mean global temperatures.
- Cook and colleagues (2013) reviewed abstracts of nearly 12,000 papers on climate; among those that took a position on the cause of recent warming, about 97% endorsed the consensus that humans are causing it.
- Lynas, Houlton and Perry (2021) examined a sample of about 88,000 climate papers and estimated that more than 99% agreed that recent warming is human-caused.
These results are consistent. They are not a vote that proves the science; they are a measure of how settled the core conclusion is among the people who know the evidence. The science is not "settled" in every detail (the amount of cloud feedback, regional rainfall changes, ice sheet timing are active research), and good communication distinguishes the solid core from the open frontier. Surveys show that the public often underestimates the level of expert agreement, and correcting that "gap" can increase concern and support for action.
The five techniques of misinformation
John Cook and colleagues grouped common contrarian arguments into five techniques, summarized as FLICC. Learning the technique helps you recognize a false claim even when you have never seen the specific claim before.
- Fake experts. Presenting someone without relevant expertise (or a long list of signatories who are not climate scientists) as an authority.
- Logical fallacies. Reasoning errors: "the climate has changed naturally before, so humans cannot be changing it" (a false dichotomy; natural causes do not rule out human ones); "it snowed today, so there is no warming" (a hasty generalization).
- Impossible expectations. Demanding certainty or perfection before action ("models are not perfect, so ignore them").
- Cherry-picking. Selecting data that fits and ignoring the rest, such as choosing the exceptionally hot year 1998 as a start date to claim that "warming has paused."
- Conspiracy theories. Claiming that thousands of independent scientists in dozens of countries are secretly coordinating a hoax.
Beyond denial of the science, researchers also describe discourses of delay, which accept that climate change is real but argue against meaningful action: "someone else should act first," "it is too late," "technology will save us," or "the costs are too high." Recognizing these is part of climate literacy too.
How to respond: inoculation and the fact-myth-fallacy-fact layout
Repeating a myth can accidentally strengthen it, and debunking after the fact is slow. The research on inoculation theory (William McGuire in the 1960s, applied to climate by Sander van der Linden, Cook and others) suggests a better approach: warn people in advance that a misleading technique exists and explain how it works, a mental "vaccine." Experiments find that inoculation can reduce the effect of misinformation, and that technique-based inoculation can work across topics.
A practical message layout:
- Lead with the fact, short, clear and true ("Extra CO₂ traps heat; this has been measured in the lab and from space since the 1800s and 1970s").
- Name the myth once, with a warning before showing it.
- Explain the fallacy: why the myth feels persuasive but fails (for example, cherry-picking a start date).
- End with the fact, reinforced, with a next step people can take.
Five techniques (FLICC)
Good communication
Beyond facts
Research on climate attitudes finds that information alone rarely changes minds; political identity, trust and values shape how people hear it. Messages work best when the messenger is trusted by the audience, the framing connects to what they care about (health, local economy, security, faith, stewardship, children's future), and the message is concrete and local. Fear alone tends to backfire: people who feel helpless switch off. Pairing risk information with efficacy, specific things people can do, works better. Honest communication also admits what is not known.
Reading charts honestly
Charts are powerful and easy to abuse.
- Baseline and period. A chart showing temperature change should state the baseline (such as 1850-1900 or 1951-1980). Different baselines shift the line up or down but do not change the trend.
- Window length. Climate is defined over decades (the World Meteorological Organization uses 30-year normals). Short windows are dominated by natural variability.
- Axis range. Truncating the y-axis can exaggerate small changes; stretching the axis can hide real ones. Ask what the zero or the full range would look like.
- Source and uncertainty. Good charts cite data sources and show uncertainty bands.
- Context. Single-year records (one hot year, one cold winter) do not by themselves show a trend; the long record does.
Common misconceptions
"97% of scientists agree" means science is decided by a vote. The figure measures how strongly experts who studied the evidence agree on the core conclusion. The reasons are the evidence, not the headcount.
"Debunking a myth in detail always helps." Repeating a myth at length can increase its familiarity. Lead with facts, and explain the technique.
"If people knew the facts, they would agree." Values, identity and trust matter as much as knowledge.
Try it
First, cherry-picking. This synthetic series has a steady warming trend plus natural variability. The code measures how many short windows show a cooling trend even though the long-term trend is up. The data are generated, not observed.
Press Run (or Ctrl + Enter) to see the result here.
Program input · what you'd type while the program runs
Type the answers before you press Run, one per line. Each time the program reads a line (with input()), it gets the next line from this box.
Second, a likelihood translator. Look up the probability range behind each IPCC term.
Press Run (or Ctrl + Enter) to see the console output here.
No output.
Third, the effect of the y-axis range. The same synthetic data are plotted with a truncated and with a full-range axis; both are honest only if labelled.
Press Run (or Ctrl + Enter) to see the result here.
Program input · what you'd type while the program runs
Type the answers before you press Run, one per line. Each time the program reads a line (with input()), it gets the next line from this box.
Check your understanding
Quick check · 5 questions
of 5 answered You scored / 5 · perfect!
-
1. In IPCC language, 'very likely' corresponds to a probability of
Very likely means 90 to 100%; likely means 66 to 100%. -
2. Choosing 1998 as a start date to claim that warming has paused is an example of
It selects a convenient window that begins with an exceptionally warm year. -
3. What is the idea behind inoculation against misinformation?
Pre-exposure with a weakened dose of the technique builds resistance. -
4. What do consensus studies measure?
They quantify expert agreement on the core conclusion. -
5. Which is the best structure for correcting a myth?
The fact-myth-fallacy-fact layout leads and ends with the truth.
Summary
- IPCC confidence and likelihood terms are calibrated and have defined probability ranges.
- Consensus studies find 97% to over 99% expert agreement that recent warming is human-caused, while details remain open research.
- The five techniques of denial (FLICC) and discourses of delay help you recognize misleading arguments.
- Inoculation and the fact-myth-fallacy-fact layout work better than repeating myths.
- Read charts for baseline, window length, axis range, source and uncertainty.
Next: Chapter review
Track your progress
Create a free account to tick off lessons and pick up where you left off on any device.
of Climate Science lessons completed