


















Lesson 20 of 48 · Climate Records and Proxies
Ice cores: a library of ancient air
Learn how ice cores are drilled, dated and read: annual layers, trapped air bubbles, water isotopes as thermometers, and what 800,000 years of CO₂, methane and temperature show.
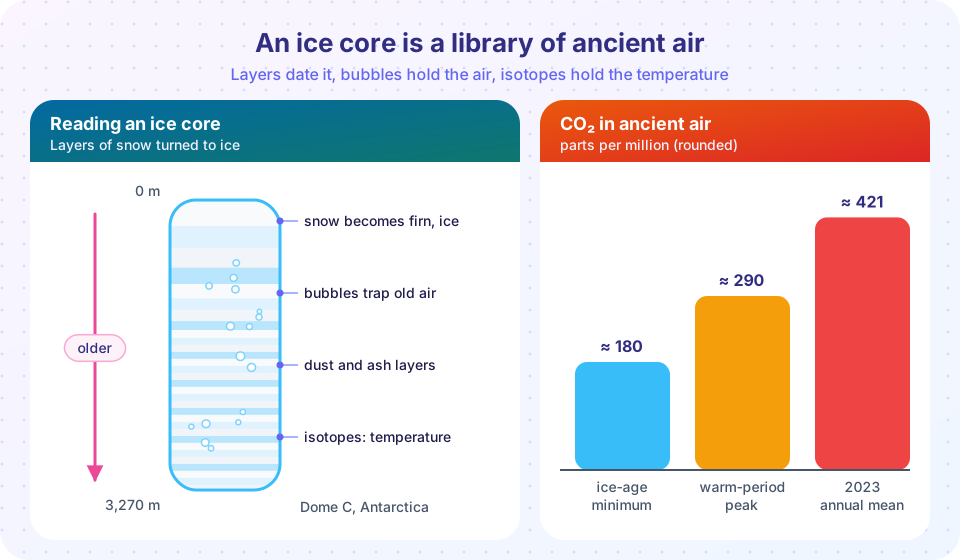
In the middle of Antarctica and Greenland it almost never melts. Snow falls year after year, the layers pile up and the weight of the upper layers compresses the lower ones to ice. Each layer holds a sample of the atmosphere and the weather of its time: bubbles of the air that was trapped, dust blown from distant deserts, sulfur from volcanic eruptions and water molecules whose chemistry reflects the temperature when the snow fell. Drilling down and bringing up a long cylinder of this ice, an ice core, is like pulling a book from a very long shelf and reading it from the top page to the bottom.
Ice cores are the only climate archive that holds samples of ancient air, which makes them uniquely valuable. This lesson explains how they are drilled and dated, how isotopes serve as thermometers, and what the best-known cores tell us about carbon dioxide, methane and temperature over 800,000 years.
What you will learn
- Describe how snow becomes ice and how air is trapped in bubbles.
- Explain how ice cores are dated, and why the gas is younger than the ice around it.
- Explain how oxygen and hydrogen isotopes in ice record temperature.
- State the range of CO₂ and methane over the ice-age cycles and compare it with today.
- Answer the claim that "CO₂ lags temperature, so it cannot cause warming".
Key terms
Ice core: a cylinder of ice drilled from an ice sheet or glacier. Firn: compacted, porous snow between fresh snow and solid ice, tens of meters deep. Isotope: a form of an element with a different number of neutrons (for example oxygen-16 and oxygen-18). δ¹⁸O: a measure of how much the ratio of oxygen-18 to oxygen-16 in a sample differs from a standard, in parts per thousand (‰). Glacial and interglacial: a cold ice age period and a warm period between them.
From snow to ice
Fresh snow is mostly air. In regions with little melting, successive snowfalls bury older snow. Under the weight of the layers above, the grains pack closer together, and the snow slowly becomes firn, with a density of about half that of ice. Between about 50 and 120 m below the surface (depending on temperature and snowfall) the pores between grains pinch off and become sealed bubbles. From then on the air is trapped. Deeper still, the ice is dense and the bubbles are compressed.
The trapped air is not as old as the ice around it. Air in the open pores of the firn mixes with the atmosphere above, so it is only sealed off decades to thousands of years after the snow fell, depending on how quickly the site accumulates snow. In Greenland the difference is a couple of hundred years; at the cold, dry Antarctic plateau sites, it may be several thousand. Scientists calculate this gas-age difference with models of firn compaction and take it into account.
Drilling and the main cores
Drilling is done with a hollow, motorized cutting head that is lowered into a hole filled with a fluid that prevents the hole from closing. A cylinder of ice, perhaps 3 to 4 m long, is pulled up on each run. A 3-km core takes several drilling seasons and hundreds of runs. The cores are cut, labeled and kept at about -30 °C until they are analyzed.
- Greenland (GRIP and GISP2, drilled in the early 1990s; NGRIP, 2000s): about 3,000 m deep, covering the last 100,000 to 120,000 years with sharp annual detail, where abrupt climate shifts show up clearly.
- Vostok (Antarctica, Russia): 3,623 m deep; its record covers about 420,000 years, or four glacial cycles. Published in 1999, it showed that CO₂ and temperature rose and fell together.
- EPICA Dome C (Antarctica, European project): 3,270 m deep, completed in 2004 and covering about 800,000 years, or eight glacial cycles, the longest continuous record from the ice sheets so far.
- Older ice: projects are drilling to recover continuous ice up to 1.5 million years old, and older fragments, about 2 million years old, have been recovered from "blue ice" areas where old ice is pushed to the surface.
Dating the ice
For recent periods the ice has visible or chemical annual layers, as in tree rings: summer and winter snow differ in dust and chemistry, and each year can be counted. Layer counting in Greenland reaches back about 60,000 years. With depth the layers thin, because the weight of the ice above squeezes them and the ice flows outward, so annual layers become undetectable. Then scientists rely on ice-flow models, known volcanic eruptions that left sulfate spikes (with ages known from historical records or tree rings), and matching features in the core with other dated records such as the orbital cycles (lesson 5).
A simple flow model shows how the layer thickness and age change with depth. If snow accumulates at a rate a (in meters of ice per year) and the ice is H meters thick, then the layer thickness at depth z is about a(1 - z/H) and the age is about (H/a) ln[H/(H - z)]. This is the Nye model. The second TryIt below uses it.
Water isotopes as thermometers
Water molecules in nature contain light and heavy isotopes of oxygen (¹⁶O and ¹⁸O) and hydrogen (¹H and ²H, called deuterium). The heavier molecules evaporate slightly less readily and condense slightly more readily. As a moist air mass travels from the tropics toward the poles it cools and rains out, and each rainout removes heavier molecules first, so the vapor left over becomes progressively lighter. Snow that falls in a cold place such as the interior of Antarctica therefore contains less ¹⁸O than snow in a warmer place.
Because of this, the ratio of heavy to light isotopes in the ice, written as δ¹⁸O or δD, depends on the temperature at which the snow formed. Colder conditions mean more negative values. Scientists calibrate the relationship: in central Antarctica, roughly 6 ‰ in δD per °C, while in Greenland the slope is about 0.5 to 0.7 ‰ in δ¹⁸O per °C (it varies in time, so calibration uses additional evidence such as the temperature profile in the borehole, which preserves a memory of past surface temperature). Using such calibrations, the Antarctic cores show that the ice ages were colder than the warm periods by about 8 to 10 °C locally, which corresponds to roughly 6 °C globally.
Worked example
Suppose a section of an Antarctic core has δD values 60 ‰ lower than the Holocene (the present warm period). With a slope of 6 ‰ per °C, the local temperature was about 60 / 6 = 10 °C lower. Local changes are larger than global ones because polar regions amplify temperature change.
What the bubbles show
Measuring the gas in bubbles gives direct samples of ancient air. The results are strikingly regular.
- Carbon dioxide varied between about 180 ppm in the coldest parts of ice ages and about 280 to 300 ppm in warm interglacials. It never rose above about 300 ppm in the 800,000 years of ice core data until the industrial era; it is now over 420 ppm.
- Methane varied between about 350 ppb in ice ages and 700 to 800 ppb in warm periods, and is now about 1,900 ppb, about 2.6 times the pre-industrial level.
- Temperature, CO₂ and methane move together over the glacial cycles, rising and falling in step, which shows that greenhouse gases are part of the way the planet responds to orbital changes (lesson 5).
Other substances in the core record different things: dust is higher in cold, dry times, sulfate shows volcanic eruptions, and beryllium-10 reflects solar activity. Lead in Greenland ice rises in Roman times from mining and smelting, and radioactive fallout from 1950s and 1960s nuclear tests marks a clear horizon.
Abrupt change in Greenland
The Greenland cores show that climate can change fast. During the last ice age, temperatures in Greenland jumped by 8 to 16 °C within decades about 25 times (the Dansgaard-Oeschger events), then cooled slowly. A famous cold snap, the Younger Dryas (about 12,900 to 11,700 years ago), ended with a warming of about 10 °C in a few decades. These events were largely related to changes in the Atlantic overturning circulation (chapter 2), and they show that the climate system has thresholds.
Common misconceptions
"Ice cores show that CO₂ follows temperature, so it cannot cause warming." At the end of an ice age, the first push comes from orbital changes that warm the Southern Hemisphere, and CO₂ starts rising some hundreds of years later as the warming ocean releases gas. But CO₂ then amplifies the warming, and most of the global warming at the end of the last ice age came after CO₂ had begun to rise. CO₂ both responds to and drives temperature: it is a feedback in the ice age cycles and a forcing today. Both statements are true, and they are not contradictory.
"Ice core CO₂ is not reliable because gas can escape." Air bubbles are sealed in very cold, dry ice, and measurements from different cores in Greenland and Antarctica, with different accumulation rates and gas ages, give consistent results. Recent decades of ice cores match direct air measurements.
"Ice cores measure global temperature directly." They measure local isotopes, which are calibrated to local temperature. Global estimates come by combining multiple cores and other proxies.
Try it
The first example converts an isotope shift to a temperature change and plots the idealized relationship, using the calibrations described above.
Press Run (or Ctrl + Enter) to see the result here.
Program input · what you'd type while the program runs
Type the answers before you press Run, one per line. Each time the program reads a line (with input()), it gets the next line from this box.
The second example is the Nye model: slide down the core and see how thin the annual layers get and how old the ice is. It is a simple model with constant accumulation, not a real age scale, but it captures why the deepest ice is hard to read.
The third example uses a made-up pair of curves to show how a CO₂ lag can coexist with CO₂ driving warming. All data are synthetic.
Press Run (or Ctrl + Enter) to see the result here.
Program input · what you'd type while the program runs
Type the answers before you press Run, one per line. Each time the program reads a line (with input()), it gets the next line from this box.
Check your understanding
Quick check · 6 questions
of 6 answered You scored / 6 · perfect!
-
1. Why is the gas trapped in an ice core younger than the ice around it?
Air in the firn mixes with the atmosphere until the pores seal, so the gas is younger than the surrounding ice. -
2. What do more negative δ¹⁸O values in polar ice indicate?
Colder, more distilled air masses carry less of the heavy isotope, so the snow has lower δ¹⁸O. -
3. Which range describes CO₂ in ice core samples over the last 800,000 years before the industrial era?
CO₂ varied between about 180 ppm in ice ages and about 280 to 300 ppm in warm periods. -
4. In ice cores, CO₂ often lags Antarctic temperature at the start of a deglaciation. How does this fit with CO₂ affecting climate?
Both statements hold: orbital forcing starts the change and CO₂ amplifies it; today CO₂ is itself the forcing. -
5. About how deep and old is the EPICA Dome C core?
EPICA Dome C reached 3,270 m, covering about eight glacial cycles. -
6. Why does counting annual layers get harder with depth?
Ice flow and compression thin the layers until they are too thin to separate.
Summary
- Ice cores come from ice sheets where snow compacts into firn and then ice; bubbles trap samples of ancient air.
- Ice is dated by counting layers, volcanic markers and flow models; gas is younger than the surrounding ice.
- Water isotopes (δ¹⁸O, δD) are calibrated thermometers: colder snow has less of the heavy isotope.
- Over 800,000 years CO₂ ranged about 180 to 300 ppm and methane about 350 to 800 ppb; today they are over 420 ppm and about 1,900 ppb.
- CO₂ lags temperature at deglaciations because it acts as a feedback that amplifies an orbital push.
Track your progress
Create a free account to tick off lessons and pick up where you left off on any device.
of Climate Science lessons completed