


















Lesson 48 of 48 · Projects and Practice
Further study: where to go next in climate science
Plan your next steps after the climate science course: related tracks on this site, open data sources, major reports and ways to practice with real climate data.
You have now followed climate science from the energy balance of a planet to the arithmetic of carbon budgets and the design of international agreements. That is a solid foundation, and it opens several paths. Some lead deeper into the physical science, some toward the data and statistics, some toward the economics and policy, and some toward practical action in your own community or career.
This lesson suggests where to go next, which primary sources to trust and how to keep up with a field that moves quickly. It also gives you a simple way to choose a path based on what interested you most.
What you will learn
- Choose the next track that matches your interests.
- Name reliable primary sources of climate data and assessments.
- Plan a small project with real data.
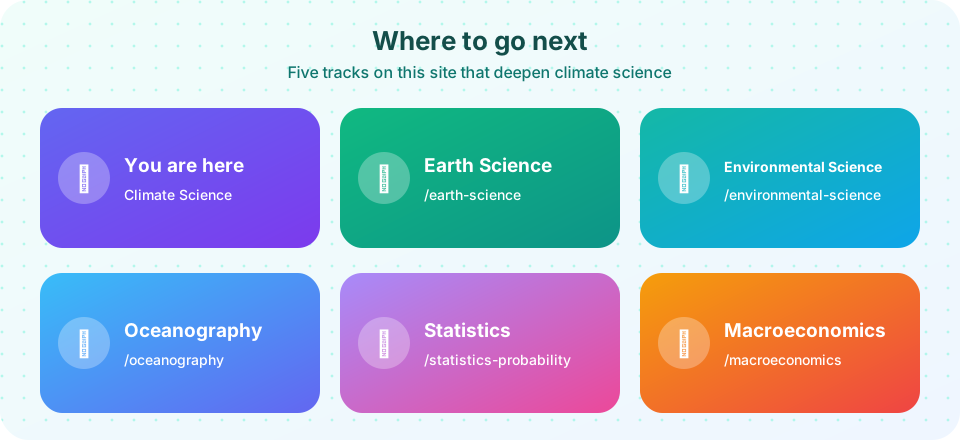
Tracks on this site
Earth Science: the solid Earth, the atmosphere and the water cycle in more depth, including past climates recorded in rocks, ice and sediments. Pick this if the paleoclimate and climate system chapters of this course were your favorites.
Environmental Science: ecosystems, biodiversity, pollution, resources and sustainability. Pick this if the impacts on living systems and the mitigation toolbox interested you.
Oceanography: ocean circulation, heat uptake, sea level, acidification and marine life. Pick this if you want to understand the single biggest heat store of the climate system.
Statistics and Probability: distributions, trends, uncertainty and testing, the tools behind attribution, ensembles and honest charts. Pick this if the chapters on extremes, uncertainty and misinformation caught your attention.
Macroeconomics: growth, investment, prices and policy at the scale of a whole economy. Pick this if the carbon pricing and the Kaya identity discussions made you want the economics behind them.
Other tracks on the site, such as Python, NumPy and pandas, give you the programming tools to analyze real data. The Python code in this course used only a small part of what these tools can do.
Primary sources worth bookmarking
The most valuable habit in climate literacy is to go to the source.
- IPCC assessment reports and the Summary for Policymakers. The Sixth Assessment Report (2021-2023) has three working-group volumes (the physical science basis; impacts, adaptation and vulnerability; mitigation) and a synthesis report. The summaries are written to be read by non-specialists, and the technical chapters carry the references.
- Observation datasets. Global temperature series are produced independently by NASA (GISTEMP), NOAA, the UK Met Office with the University of East Anglia (HadCRUT), and Berkeley Earth; the European Copernicus service publishes reanalysis data. CO₂ concentration is measured at Mauna Loa (the Keeling Curve) and many other stations. Sea level comes from tide gauges and satellite altimetry; Arctic sea ice from the US National Snow and Ice Data Center.
- Emissions data. The Global Carbon Project publishes the annual global carbon budget; national inventories are reported to the UNFCCC; Our World in Data collects and visualizes many series.
- Policy trackers. The UNEP Emissions Gap and Adaptation Gap reports, the Climate Action Tracker, the World Bank's carbon pricing dashboard and national statistics give the state of policy.
- Explainers. Several science journalism outlets and university groups publish careful explainers, and many modeling centers publish their code and documentation openly.
When a number matters, look at the original dataset or the report chapter, note the baseline and period, and read the uncertainty. Secondary summaries sometimes drop those details.
Practicing with real data
You can start a small project with only a laptop and the Python skills from this course.
- Plot the Keeling Curve. Download the monthly CO₂ record from Mauna Loa, plot it, and separate the long-term rise from the seasonal cycle. Why does the cycle dip in the northern summer?
- Trend and uncertainty. Download a global temperature series, compute the linear trend over different 10-, 20- and 30-year windows, and reproduce the cherry-picking exercise with real data.
- Extremes in your city. Take daily maximum temperatures for a nearby station and count days above a threshold by decade.
- Emissions comparison. Using national data, compare per-person and total emissions of several countries, and relate the results to the Kaya factors.
- Your own pathway. Extend the emissions-pathway calculator with exponential decline, non-CO₂ gases and uncertainty bands.
Whatever you choose, document the data source and the date you downloaded it, state the baseline, and write down what the analysis cannot tell you.
Ways to take part
Climate science is a field where learning can be turned into action at many scales. You might calculate the emissions of your school or workplace and propose changes; join a local group working on adaptation (tree planting, flood preparedness, heat plans); support citizen science projects that record phenology, rainfall or coral health; or, if you are aiming at a career, look at the many paths from atmospheric physics to data science, energy engineering, ecology, public health, economics, law, planning, journalism and teaching. Keep reading with a critical eye, check claims against primary sources, and be generous with uncertainty and honest about it: that is what scientists do.
Try it
First, a small helper that suggests a next track from your answers. It is a simple lookup, meant to make the choice concrete.
Press Run (or Ctrl + Enter) to see the console output here.
No output.
Second, a study-plan generator. Enter hours per week and it divides time among a reading source, a data project and revision.
Press Run (or Ctrl + Enter) to see the console output here.
No output.
Check your understanding
Quick check · 5 questions
of 5 answered You scored / 5 · perfect!
-
1. Which source is the best place to find a careful assessment of the physical science of climate change?
The IPCC assesses the published literature and is reviewed by experts and governments. -
2. Which track would deepen your understanding of trends, uncertainty and testing?
Statistics is the toolbox behind attribution, ensembles and honest charts. -
3. What should you always note when you analyze a temperature dataset?
Those details determine how the result can be interpreted and compared. -
4. The Keeling Curve records
It is the long record of CO₂ measured at Mauna Loa Observatory since 1958. -
5. Which is the best way to extend the emissions-pathway project?
Adding realism and uncertainty, and stating assumptions, makes the model more honest.
Summary
- Related tracks here (Earth Science, Environmental Science, Oceanography, Statistics and Probability, Macroeconomics) deepen different parts of climate science.
- Trust primary sources: IPCC reports, observation datasets, emissions inventories and policy trackers.
- Practice with real data: Keeling Curve, trends and windows, local extremes, emissions comparisons.
- Climate literacy is a habit: check sources, units, baselines and uncertainty.
Next: back to the Climate Science course page
Track your progress
Create a free account to tick off lessons and pick up where you left off on any device.
of Climate Science lessons completed