


















Lesson 33 of 48 · Impacts and Risks
Chapter 6 review: impacts and risks
Review risk, sea level, heat and water extremes, ecosystems and tipping points with a one-picture summary, recap table, calculators and ten questions.
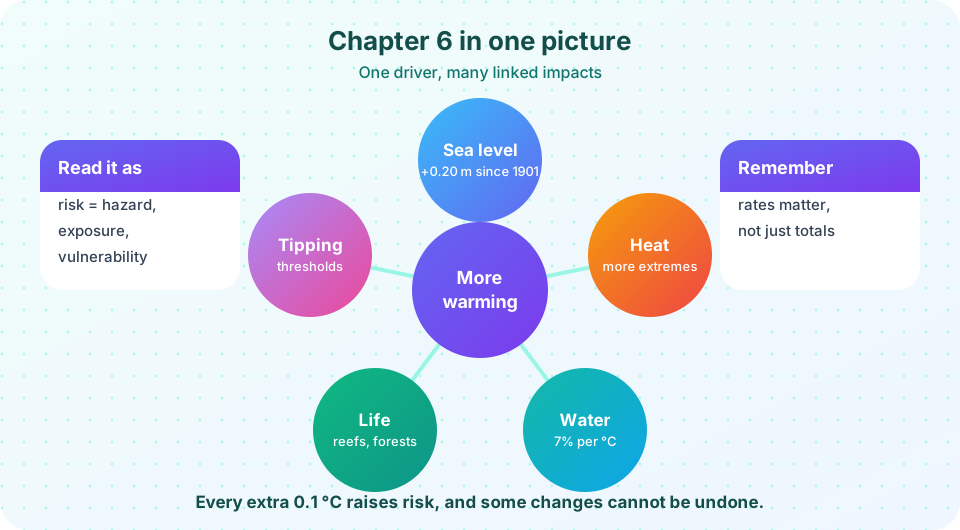
This chapter followed a chain: more warming leads to physical changes (a higher sea, hotter extremes, a wetter atmosphere), which lead to impacts on living systems and people, which lead to risk that depends on exposure and vulnerability. The review brings the links together. Look at the picture, scan the table, run the two small tools and then try the ten questions.
Recap table
| Topic | Key idea | Numbers worth remembering |
|---|---|---|
| Risk | Hazard × exposure × vulnerability | 1.1 °C warming in 2011-2020 |
| 1.5 °C vs 2 °C | Risk rises steeply with each step | Reefs: 70 to 90% lost vs about 99% |
| Sea level | Land ice melt plus thermal expansion | 361 Gt of ice = 1 mm; 0.20 m in 1901-2018 |
| Sea level rate | Accelerating | 1.3, 1.9, then 3.7 mm per year |
| Projections | Scenario-dependent, plus a long tail | 0.28 to 0.55 m (SSP1-2.6) vs 0.63 to 1.01 m (SSP5-8.5) by 2100 |
| Extremes | Small shifts, big tails | 2-sigma day: 2.3% to 6.7% after +0.5 sigma |
| Water | Clausius-Clapeyron | About 6 to 7% more vapor per °C |
| Heat stress | Wet-bulb temperature | About 35 °C theoretical limit; lower in practice |
| Acidification | pH falls, H⁺ rises | pH 8.2 to 8.1 is about +26% H⁺ |
| Tipping points | Threshold, feedback, hysteresis | Several elements near 1.5 °C or above, with wide ranges |
Linking the lessons
A good habit is to trace a single effect through the chain. Take sea level. Warming (driver) melts glaciers and heats the ocean (physical response); water rises (hazard); a coastal city with homes on the shoreline (exposure) and weak defenses (vulnerability) faces flood risk, and a sea wall or planned retreat lowers it (adaptation). Or take heat: a shifted distribution makes 40 °C days more common; humidity raises the wet-bulb temperature; a city with shade, cooling centers and warnings is less vulnerable than one without.
Three themes cut across the chapter.
- Non-linearity. Impacts grow faster than temperature: tails of distributions, the logarithm in pH, thresholds in coral and ice.
- Inertia and commitment. Sea level and ice respond slowly, so decisions now shape the centuries ahead.
- Fairness. Vulnerability, not just hazard, shapes who is harmed, which is why adaptation and finance appear in later chapters.
When you read a headline about an impact, ask three questions: Which hazard? Who is exposed? How vulnerable are they? The answers show you what would reduce the risk.
A worked synthesis question
A coastal city has seen its mean sea level rise by 0.5 m relative to a century ago. Engineers say the city's flood defenses were designed for a surge that, in the old climate, reached 2.0 m above mean sea level only once in a hundred years. What has changed, and what can the city do?
Think in terms of heights above the land. A surge that reaches 2.0 m above the old mean level now needs only 1.5 m above the new mean to flood the same street. If a 1.5 m surge used to occur about once in ten years, then the old once-in-a-century flood height is reached about once in ten years today, with no change in the storms themselves. That is the arithmetic behind "rare events become routine." Now use the risk triad. The hazard can be limited only by global mitigation, which acts slowly. Exposure can be reduced by zoning, by not building in the lowest areas, and by planned retreat. Vulnerability can be reduced by raising floors, protecting power and water systems, building a sea wall, restoring marshes, and establishing warnings and evacuation plans. Because sea level will keep rising for centuries, a good plan uses flexible designs that can be upgraded, with explicit triggers for the next step.
Try it
This tool recomputes three recurring chapter calculations in one place.
Press Run (or Ctrl + Enter) to see the result here.
Program input · what you'd type while the program runs
Type the answers before you press Run, one per line. Each time the program reads a line (with input()), it gets the next line from this box.
Now a console flashcard run for revision.
Press Run (or Ctrl + Enter) to see the console output here.
No output.
Check your understanding
Quick check · 10 questions
of 10 answered You scored / 10 · perfect!
-
1. Which pairing correctly matches a risk component with an example?
Exposure is who or what is in the way. The storm surge is the hazard, and a sea wall is adaptation. -
2. How much land ice must melt to raise global sea level by 1 mm?
The ocean area of 3.61e14 m² times 1 mm gives about 361 Gt of water. -
3. The rate of global sea level rise in 2006-2018 was about
AR6 gives about 3.7 mm per year for that period, nearly triple the early 20th-century rate. -
4. If the mean temperature shifts upward, the frequency of hot extremes
The tail beyond a fixed threshold is very sensitive to a shift in the center. -
5. Which is NOT a direct effect of warm air holding more water vapor?
Atmospheric vapor is a tiny amount of water and does not raise sea level; it does amplify warming and rainfall intensity. -
6. A drop in pH from 8.2 to 7.8 raises hydrogen ion concentration by about
10^0.4 is about 2.51, so about a 150% increase. -
7. Which statement about tipping points is correct?
Tipping systems have thresholds with large uncertainty and often respond over long timescales. -
8. Why does a vulnerable region suffer more from the same hazard?
Vulnerability multiplies hazard and exposure in risk. -
9. The IPCC special report on 1.5 °C assessed coral reef loss at 2 °C as about
About 99% of warm-water reefs are projected to be lost at 2 °C, versus 70 to 90% at 1.5 °C. -
10. What does 'committed' sea level rise mean?
Deep-ocean warming and ice sheet adjustment continue for centuries after surface temperature stabilizes.
Summary
- Risk combines hazard, exposure and vulnerability; adaptation reduces exposure or vulnerability.
- Sea level has risen about 0.20 m since 1901 and will keep rising for centuries.
- Extremes change faster than averages; warm air adds about 6 to 7% water vapor per °C.
- Living systems (reefs, species ranges, crops, health) show strong, uneven impacts.
- Tipping points with hysteresis argue for caution about overshoot.
Track your progress
Create a free account to tick off lessons and pick up where you left off on any device.
of Climate Science lessons completed