


















Lesson 31 of 48 · Impacts and Risks
Heat, water and extremes
Learn why a small shift in average temperature makes extreme heat far more likely, how warm air adds rain and drought, and how attribution science works.
When people hear "1 °C of warming," they picture a slightly warmer day. What they feel, though, is not the average. It is the hottest afternoon of the summer, the downpour that overwhelms the drains, the dry spell that withers the crop. Averages move a little; extremes move a lot. This lesson explains why, and what the physics of heat and water imply for the world's weather.
You will use two ideas: the statistics of a shifting distribution, and the Clausius-Clapeyron relation that links temperature to the amount of water vapor air can hold. Then you will see how scientists now work out whether a particular event would have been possible without human-caused warming.
What you will learn
- Explain how shifts in mean and spread change the frequency of extremes.
- Use the Clausius-Clapeyron relation (about 6 to 7% per °C).
- Describe changes in heat, heavy rain, drought, fire weather and storms.
- Explain how attribution studies estimate human influence on events.
Key terms
Return period: the average time between events of a given size (a "once in 50 years" event). Clausius-Clapeyron relation: the rate at which the water vapor capacity of air rises with temperature. Wet-bulb temperature: the lowest temperature reached by evaporating water into the air, a measure of combined heat and humidity. Compound event: several hazards at once, such as heat plus drought. Attribution: quantifying how much human influence changed the likelihood or intensity of an event.
Why a small shift makes big extremes
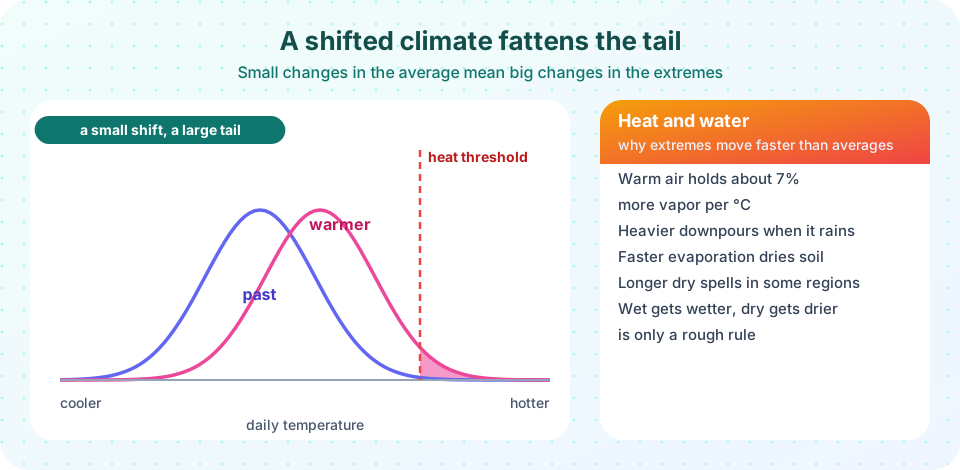
Day-to-day temperatures at a location follow roughly a bell curve. The average sits in the middle and rare hot days lie in the right-hand tail. Suppose a heat wave starts at a threshold two standard deviations above the mean. In the past climate, that tail contains about 2.3% of days. Shift the entire distribution warmer by half a standard deviation and the tail grows to 6.7%. Shift by a full standard deviation and it is 15.9% of days. A modest shift in the middle produces a large change in the tail.
Small shift, big tail
Same threshold each time
Two things can change
Observed temperature extremes have shifted this way. The IPCC concluded that hot extremes have become more frequent and more intense across most land regions since the 1950s, while cold extremes have become less frequent and less severe. Extremes can also change by more than the average: in some regions, soils dry out and the land heats up faster than the global mean, which can drive hot extremes upward faster than mean warming.
Heat and the human body
Heat stress depends on humidity as well as temperature, because sweating cools us only if it can evaporate. The wet-bulb temperature captures both. Theoretical work suggests that a sustained wet-bulb temperature of about 35 °C (for example, 35 °C at 100% humidity, or roughly 45 °C at 50% humidity) would exceed the limit at which a healthy person at rest in the shade can lose enough heat. Laboratory studies of young healthy adults found that the practical limit can be lower, in the low 30s °C wet-bulb, depending on conditions, and the limit is lower again for the elderly or those with illnesses. Wet-bulb temperatures have occasionally approached these values in parts of the Persian Gulf and South Asia, though briefly. Heat is already a leading cause of weather-related death. Risk is highest in cities (the urban heat island adds several degrees), for outdoor workers, and where air conditioning is unavailable or the power grid fails.
Water: Clausius-Clapeyron
Warm air can hold more water vapor. The saturation vapor pressure eₛ of water rises almost exponentially with temperature. A good approximation (the Magnus formula) is
eₛ(T) = 6.112 × exp( 17.62 T / (243.12 + T) ) hPa, T in °C
Differentiating, the fractional growth per degree is 17.62 × 243.12 / (243.12 + T)². At 0 °C that is about 7.2% per °C, at 15 °C about 6.4%, and at 30 °C about 5.7%. A common rule of thumb says air holds about 7% more water per °C, with actual values from about 6 to 7% in typical conditions.
Because the atmosphere's humidity is largely set by evaporation from warm oceans, it has risen roughly in line with this relation. Observations show increased column water vapor over the oceans. This extra moisture is a feedback that amplifies warming and a raw material for heavy rain.
Heavier downpours
When a storm rains, the amount of water it can condense depends on how much vapor the air holds. So extreme rainfall rises at about the Clausius-Clapeyron rate in many places, around 7% per °C, and over some regions more than that when storm dynamics intensify. The IPCC found heavy precipitation has increased over most land areas with good data. Impact: surface-water floods, flash floods and landslides. Hurricane Harvey (2017) dumped over 1 m of rain in parts of Texas, and attribution studies found a fraction of that rainfall was added by warming.
Drought and the water balance
The story is not simply "wetter." Warmer air has more evaporative demand: it pulls water out of soil and plants faster. Where rainfall does not increase, soils dry out and agricultural and ecological droughts become more likely and more severe. Changes in circulation shift where rain falls, with the subtropics tending to dry. Earlier snowmelt in mountains changes when rivers peak, and glacier retreat reduces summer flow in the long run in glacier-fed basins. A rough slogan, "wet regions get wetter and dry regions get drier," is true in some oceanic patterns, but over land the picture is more complicated.
Wildfire, storms and compound events
Hot, dry, windy weather creates fire weather. Observed increases in the length of the fire season and in the area burned in places such as western North America, Australia and the Mediterranean have been linked to warming plus land management history. Tropical cyclones are expected to have a larger proportion of intense storms (category 4 and 5), higher rainfall rates and, with a higher sea, stronger surges; their total number may not rise. Compound events, like heat plus drought, or heavy rain on a catchment already soaked, are a major concern because the damage can exceed the sum of the parts.
Attribution: was it climate change?
Extreme event attribution, pioneered by Myles Allen, Peter Stott and others in the early 2000s, answers a probabilistic question. Take the observed event. Using climate models and statistics, estimate how likely it was in the actual climate and how likely it would be in a counterfactual world without human greenhouse gas emissions. The ratio is the risk ratio, and a change in intensity can be quoted too.
For example, a rapid attribution study of the June 2021 Pacific Northwest heat dome, where temperatures reached 49.6 °C at Lytton, British Columbia, concluded that the event would have been virtually impossible without human-caused climate change. Attribution is easiest for heat waves, harder for rainfall and hardest for events driven by circulation. The studies make no claim that climate change caused the event in a simple sense; they say how much it changed the odds.
Common misconceptions
"Colder winters disprove warming." Weather varies, and cold snaps still happen. Globally, cold extremes have become rarer and the trend in hot extremes is clear.
"A warmer climate means just more rain." More evaporative demand also means more drought in many regions, and the rain that does fall comes in heavier bursts.
"No single event can be linked to climate change." Attribution does not say a storm was "caused" by warming, but it can say how much warming changed its probability and intensity.
Try it
The first demonstration uses the Magnus formula to show how vapor capacity grows with temperature and how the percentage growth per degree falls slowly as it gets hotter.
Press Run (or Ctrl + Enter) to see the result here.
Program input · what you'd type while the program runs
Type the answers before you press Run, one per line. Each time the program reads a line (with input()), it gets the next line from this box.
The second demonstration calculates how often a fixed hot threshold is exceeded when the mean shifts or the variance grows.
Press Run (or Ctrl + Enter) to see the result here.
Program input · what you'd type while the program runs
Type the answers before you press Run, one per line. Each time the program reads a line (with input()), it gets the next line from this box.
The third demonstration computes wet-bulb temperature from air temperature and relative humidity with an empirical formula (Stull, 2011), which is accurate to about a degree between 5 and 99% humidity.
Press Run (or Ctrl + Enter) to see the result here.
Program input · what you'd type while the program runs
Type the answers before you press Run, one per line. Each time the program reads a line (with input()), it gets the next line from this box.
Check your understanding
Quick check · 5 questions
of 5 answered You scored / 5 · perfect!
-
1. A shift in average temperature of only half a standard deviation raises the frequency of a 2-sigma hot day from about 2.3% to about
The tail beyond a fixed threshold grows nonlinearly: about 6.7% after a 0.5 sigma shift. -
2. Approximately how much more water vapor can air hold per °C of warming?
The Clausius-Clapeyron relation gives roughly 6 to 7% per °C. -
3. Why can warming increase drought even where rainfall is unchanged?
More evaporative demand removes water from soils and plants faster. -
4. What does wet-bulb temperature measure?
It is the temperature reached by evaporative cooling and reflects how well sweat can cool the body. -
5. What does an extreme-event attribution study estimate?
Attribution compares event likelihood in the real climate with a counterfactual climate without human emissions.
Summary
- A small shift in the mean, or a wider spread, multiplies the frequency of extremes.
- Warm air holds about 6 to 7% more vapor per °C, feeding heavier downpours.
- Evaporative demand rises with temperature, so drought can worsen even without less rain.
- Heat stress depends on humidity as well as temperature, captured by wet-bulb temperature.
- Attribution studies quantify how much human influence changed an event's odds.
Track your progress
Create a free account to tick off lessons and pick up where you left off on any device.
of Climate Science lessons completed