


















Lesson 27 of 48 · Climate Models
Scenarios and uncertainty
Understand shared socioeconomic pathways, forcing levels, ensembles and the three sources of uncertainty that shape every climate projection.
Nobody knows how much carbon dioxide humans will emit over the next eighty years, because it depends on choices that have not been made yet. So climate models do not predict the future; they project it, answering a conditional question: if the world follows this path of emissions, what will the climate do? The set of paths scientists use is called a family of scenarios.
This lesson shows how those scenarios are built, how to read the labels such as SSP2-4.5, and why every projection comes with a range. Understanding uncertainty is not a weakness of climate science. Knowing exactly what is known, what is not, and why, is part of the science.
What you will learn
- Explain what a scenario is and how an SSP differs from an RCP.
- Read labels such as SSP2-4.5.
- Name the three sources of uncertainty and how their importance changes with time.
- Interpret likelihood language and the idea of climate sensitivity ranges.
Key terms
Scenario: a coherent, internally consistent description of how the future might unfold, not a forecast. SSP (Shared Socioeconomic Pathway): a story about population, economy, technology and policy. Radiative forcing pathway: the extra energy imbalance, in W/m², that a scenario reaches in 2100. Ensemble: a collection of model runs used to sample uncertainty. ECS: equilibrium climate sensitivity, the long-term warming for doubled CO₂.
From RCPs to SSPs
The first generation of scenarios (used in the 2013-14 IPCC reports) were Representative Concentration Pathways (RCPs), labeled by the forcing level reached in 2100: RCP2.6, RCP4.5, RCP6.0 and RCP8.5 (W/m²). An RCP told you the greenhouse gas concentrations but not the world that produced them.
The newer approach separates two things:
- A socioeconomic story, the SSP, describing population, income, energy use, land use, technology and policy.
- A forcing level, the number after the hyphen, describing how strongly the climate is pushed by 2100.
So SSP2-4.5 means "the middle-of-the-road story, with climate policy sufficient to reach about 4.5 W/m² of forcing in 2100." The same forcing level can in principle be reached by different societies, and the same society can follow different policy levels. This lets scientists study impacts and mitigation together.
The five core stories
| SSP | Short name | The world in brief |
|---|---|---|
| SSP1 | Sustainability | Fast development with low resource use; strong environmental policy and cooperation |
| SSP2 | Middle of the road | Trends continue; uneven progress |
| SSP3 | Regional rivalry | Nationalism, slow growth, weak international cooperation |
| SSP4 | Inequality | Large gaps between rich and poor; a divided world |
| SSP5 | Fossil-fueled development | Rapid growth powered by fossil fuels, high energy use |
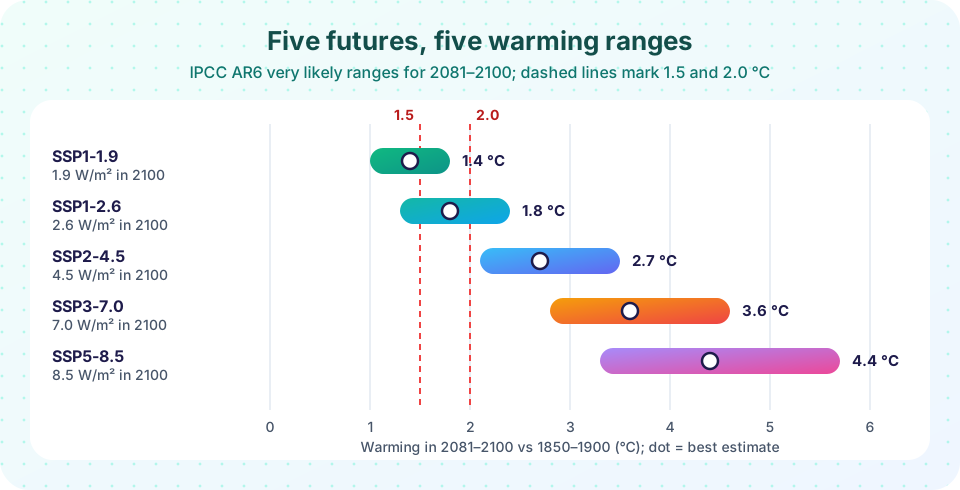
The scenarios most used in the IPCC's Sixth Assessment Report are SSP1-1.9, SSP1-2.6, SSP2-4.5, SSP3-7.0 and SSP5-8.5.
Reading a scenario label
SSP2-4.5 = story + forcing
What the numbers mean
A scenario is not a forecast
The warming numbers in the chart at the top come from the IPCC Sixth Assessment Report (2021). For the period 2081-2100, relative to 1850-1900, the best estimates are about 1.4 °C (SSP1-1.9), 1.8 °C (SSP1-2.6), 2.7 °C (SSP2-4.5), 3.6 °C (SSP3-7.0) and 4.4 °C (SSP5-8.5). The very likely ranges are roughly 1.0 to 1.8, 1.3 to 2.4, 2.1 to 3.5, 2.8 to 4.6 and 3.3 to 5.7 °C. Notice how wide the ranges are, and that they overlap between neighboring scenarios.
Likelihood language
The IPCC uses calibrated words for probability. Likely means 66 to 100%. Very likely means 90 to 100%. Extremely likely means 95 to 100%. About as likely as not is 33 to 66%. When you read that warming is "very likely" to be in a range, you are reading a statement with a stated confidence, not a hedge.
Three sources of uncertainty
Hawkins and Sutton (2009) showed that projection uncertainty has three parts, whose shares change with the forecast horizon.
- Internal variability. The climate wobbles on its own: El Niño, volcanic years, multi-decade ocean cycles. It dominates the next 10 to 20 years of regional trends and cannot be reduced by better models.
- Model (response) uncertainty. Different models respond differently to the same forcing, mainly because of cloud and other feedbacks. It dominates mid-century and is reducible by better science and better observations.
- Scenario uncertainty. What society chooses to emit. It is small for the next few decades because the climate is already committed to a lot of warming, and becomes the largest source by late century.
This pattern has a policy implication that surprises many people: the climate of 2040 is largely locked in by emissions already made and by inertia, but the climate of 2100 is largely up to us.
For regional or decadal questions, look at the spread of an ensemble rather than one run. For century-scale global temperature, the choice of scenario matters more than the choice of model.
Climate sensitivity and why ranges persist
The warming a scenario causes also depends on the climate's response to forcing. The equilibrium climate sensitivity (ECS) is the long-term warming for doubled CO₂. For decades the range stayed at 1.5 to 4.5 °C. In the IPCC's Sixth Assessment Report, combining evidence from the physics of feedbacks, the historical record, paleoclimate and emergent constraints narrowed it: a best estimate of 3 °C, a likely range of 2.5 to 4 °C and a very likely range of 2 to 5 °C.
A related number is the transient climate response (TCR): warming at the moment CO₂ has doubled in a 1%-per-year rise, about 70 years. The assessed value is 1.8 °C (likely 1.4 to 2.2 °C). TCR is lower than ECS because the deep ocean absorbs heat and delays the full response. Finally, the transient climate response to cumulative CO₂ emissions (TCRE) says that each 1000 GtCO₂ emitted adds about 0.45 °C (likely 0.27 to 0.63 °C). This near-linear link is why carbon budgets exist (see Chapter 7).
What a sensible reader does with a range
- A range is not "the scientists do not know." The shape of the range matters: the high tail is longer than the low tail for sensitivity, which makes the risk asymmetric.
- Overlap between scenarios means the choice of path matters less for the next 20 years than for 2100.
- A projection from one model is a single draw; the ensemble is the answer.
Common misconceptions
"SSP5-8.5 is a prediction of business as usual." It is a high-end scenario. Many analysts now regard it as less plausible, given falling renewable energy costs and recent policy, though it remains useful for testing risks.
"Uncertainty means we know nothing." Uncertainty is quantified. We know, with high confidence, that more CO₂ means more warming; we are less sure whether the response to doubling is 2.5 or 4 °C.
"If scenarios differ little until 2040, policy does not matter yet." It matters because emissions are cumulative and the long-lived effects (sea level, ice sheets) depend on the whole path.
Try it
First, convert concentration to equilibrium warming for different sensitivities. The code uses the standard approximation for CO₂ forcing, F = 5.35 ln(C / 280) W/m². It ignores other gases and aerosols, so it is a teaching calculation, not a projection.
Press Run (or Ctrl + Enter) to see the result here.
Program input · what you'd type while the program runs
Type the answers before you press Run, one per line. Each time the program reads a line (with input()), it gets the next line from this box.
Second, a demonstration of internal variability. This is a synthetic ensemble: a steady forced warming of 0.25 °C per decade plus random year-to-year noise with memory. The members all share the same forced trend, but short-period trends differ widely.
Press Run (or Ctrl + Enter) to see the result here.
Program input · what you'd type while the program runs
Type the answers before you press Run, one per line. Each time the program reads a line (with input()), it gets the next line from this box.
Check your understanding
Quick check · 5 questions
of 5 answered You scored / 5 · perfect!
-
1. What does the label SSP2-4.5 tell you?
SSP2 is the story; 4.5 is the radiative forcing level reached by 2100, in W/m². -
2. Which source of uncertainty dominates projections for the next 10 to 20 years?
Natural fluctuations such as El Niño dominate near-term regional changes, while scenario choice dominates late in the century. -
3. In IPCC language, what does 'very likely' mean?
Very likely is 90 to 100%, likely is 66 to 100%. -
4. The AR6 best estimate of equilibrium climate sensitivity is about
AR6 gives 3 °C with a likely range of 2.5 to 4 °C. -
5. Why is TCR lower than ECS?
At the time of doubling the climate has not reached equilibrium because the ocean is still taking up heat.
Summary
- Scenarios are conditional "if-then" paths, not forecasts.
- An SSP label combines a socioeconomic story with a 2100 forcing level in W/m².
- Uncertainty has three sources: internal variability (near term), model response (mid-century) and scenario choice (late century).
- ECS best estimate is about 3 °C (likely 2.5 to 4); TCRE is about 0.45 °C per 1000 GtCO₂.
- Ranges quantify what is known; they do not signal ignorance.
Next: Chapter review
Track your progress
Create a free account to tick off lessons and pick up where you left off on any device.
of Climate Science lessons completed