


















Lesson 29 of 48 · Impacts and Risks
Chapter 6 overview: impacts and risks
Learn the risk framework scientists use to connect warming to real-world harm, and see why every extra fraction of a degree changes outcomes.
Global average temperature is an abstract number. Nobody lives in the global average. What people care about is whether the harvest fails, whether the river floods their street, whether the coral reef that feeds their village survives. Chapter 6 connects the physics of the earlier chapters to those consequences.
The key idea of this overview is that climate impacts are not simply "the weather gets worse." Harm depends on three things at once: what the climate does, who and what is in its way, and how well they can cope. That framework, risk, is how the IPCC organizes the whole subject.
What you will learn in this chapter
- How scientists define and measure climate risk.
- Why sea level, heat, water, ecosystems and tipping points are linked.
- What changes between 1.5 °C and 2 °C of warming.
- Why adaptation limits and unfairness matter as much as the physical changes.
The risk framework
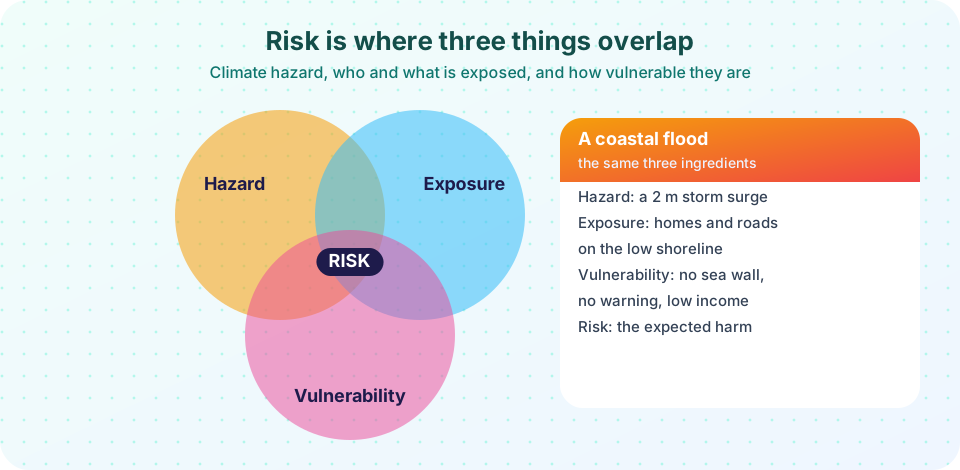
In the IPCC's framework, risk arises from the interaction of three components, plus how people respond.
- Hazard: the climate-related physical event or trend, such as a heat wave, a drought, or sea level rise.
- Exposure: the presence of people, ecosystems, buildings or economic assets in places that can be harmed.
- Vulnerability: the tendency to be harmed, shaped by poverty, health, age, governance, infrastructure and the ability to adapt.
A flood hazard in an uninhabited valley is not a risk. A heat wave in a city with air conditioning, shade, health services and early warnings is a lower risk than the same heat in a city without them. This is why a rich country and a poor country can suffer very different harm from the same storm. It is also why climate change is a question of fairness: the people who have contributed least to emissions are often the most vulnerable.
Risk has three parts
How the chapter unfolds
Two big lessons
What has already changed
Global surface temperature in 2011-2020 was about 1.1 °C above the 1850-1900 average, according to the IPCC's Sixth Assessment Report. The report concluded that it is unequivocal that human influence has warmed the atmosphere, ocean and land. Observed changes already include:
- a global mean sea level rise of about 0.20 m between 1901 and 2018;
- widespread retreat of glaciers and loss of Arctic summer sea ice;
- more frequent and intense hot extremes and heavy rainfall events in most regions with good data;
- ocean warming and acidification, and marine heat waves that bleach coral.
Many of these have been connected to human influence through attribution science, which compares the likelihood of an event in the real world with a simulated world without human emissions. Chapter 6 uses that approach repeatedly.
1.5 °C and 2 °C are not the same
The Paris Agreement names two limits: "well below" 2 °C and efforts toward 1.5 °C. A tempting thought is that half a degree is a small difference. The IPCC's 2018 special report on 1.5 °C showed otherwise.
| Outcome | At 1.5 °C | At 2 °C |
|---|---|---|
| Warm-water coral reefs | about 70 to 90% lost | about 99% lost |
| Arctic Ocean summer free of sea ice | about once per century | at least once per decade |
| Sea level rise by 2100 | about 0.1 m lower than at 2 °C | higher |
These are central assessments from that report, with their own ranges, but the pattern is clear: risks rise in a steep, non-linear way and some losses, such as coral reefs, are hard to reverse.
The IPCC also uses "burning embers" diagrams, which show how risk for five "reasons for concern" (unique and threatened systems, extreme weather, distribution of impacts, global aggregate impacts, and large-scale singular events) shifts from low to very high as temperature rises. Compared with earlier assessments, the colors turn dark red at lower temperatures than before.
What each lesson covers
- Sea level and ice: why oceans rise, what ice sheets could add, and what is committed for centuries.
- Heat, water and extremes: why extremes change faster than averages, and how attribution works.
- Ecosystems, health and tipping points: living systems, food, human health and large-scale thresholds.
- Chapter review: the picture, the recap table and a ten-question check.
Common misconceptions
"Climate change impacts are all in the future." Many are measured today: sea level, glacier retreat, heat extremes, coral bleaching events, shifts in species ranges.
"Warming is bad everywhere in the same way." Impacts vary by region and by sector, and some places see temporary benefits (a longer growing season at high latitudes). The balance of risks is still toward harm as warming grows.
"Because the risk framework includes vulnerability, climate change is just a poverty problem." Vulnerability shapes outcomes, but hazards themselves are increasing. Both sides of the equation matter.
Try it
The first demonstration is a toy risk calculator. It multiplies hazard, exposure and vulnerability scores on a 0 to 10 scale. It illustrates the logic of the framework, not a real risk assessment: reduce any one of the three factors and the product falls.
The second demonstration plots the central assessments from the IPCC 2018 special report for coral reefs, showing how steeply the loss rises between 1.5 °C and 2 °C. The values are the mid-points of the quoted ranges, so treat them as a schematic.
Press Run (or Ctrl + Enter) to see the result here.
Program input · what you'd type while the program runs
Type the answers before you press Run, one per line. Each time the program reads a line (with input()), it gets the next line from this box.
Check your understanding
Quick check · 5 questions
of 5 answered You scored / 5 · perfect!
-
1. In the IPCC risk framework, which set lists the three components of risk?
Risk arises where climate hazards meet exposed people or assets that are vulnerable. -
2. Which change reduces risk without reducing the hazard?
Early warning lowers vulnerability, so risk falls even if the physical hazard stays the same. -
3. About how much warming had occurred in 2011-2020 compared with 1850-1900 (IPCC AR6)?
AR6 reports about 1.1 °C of warming for 2011-2020. -
4. According to the IPCC 2018 special report, warm-water coral reefs at 2 °C of warming are
The special report assessed a loss of about 70 to 90% at 1.5 °C and about 99% at 2 °C. -
5. What is attribution science?
Attribution compares the real world with a simulated world without human emissions.
Summary
- Risk combines hazard, exposure and vulnerability; reduce any one and risk falls.
- About 1.1 °C of warming has already brought measurable changes in sea level, ice, extremes and ecosystems.
- Risks rise steeply between 1.5 °C and 2 °C, and some losses are hard to reverse.
- Vulnerability links climate impacts to fairness and development.
- The next lessons cover sea level, heat and water, living systems and tipping points.
Next: Sea level and ice
Track your progress
Create a free account to tick off lessons and pick up where you left off on any device.
of Climate Science lessons completed