


















Lesson 35 of 48 · Mitigation and Adaptation
Emissions and the carbon budget
Break emissions into four factors with the Kaya identity, learn why cumulative CO2 sets warming, and calculate how fast the remaining carbon budget runs out.
If you wanted to fill a bathtub to exactly the brim, you would not ask "how fast is the tap running?" You would ask "how much room is left?" Climate change works the same way for carbon dioxide. Because most of the CO₂ we emit stays in the air-ocean-land system for centuries, the warming we get depends on the total we put in, not just on how quickly we add it. That total room is the carbon budget.
This lesson gives you two tools. The Kaya identity breaks emissions into four factors so you can see which levers exist. The carbon budget turns a temperature goal into a number of tonnes. With both you can do the arithmetic that sits behind every net-zero target.
What you will learn
- Use the Kaya identity to decompose emissions growth.
- Explain why warming is proportional to cumulative CO₂ (TCRE).
- Calculate time left in a budget under different emission paths.
- Compare gases with global warming potential (GWP).
Key terms
Kaya identity: emissions = population × (GDP per person) × (energy per GDP) × (CO₂ per energy). Carbon budget: the total CO₂ that can still be emitted while keeping warming below a chosen level with a chosen probability. TCRE: transient climate response to cumulative CO₂ emissions, the warming per tonne emitted. GWP: global warming potential, the warming effect of a gas relative to CO₂ over a set period, usually 100 years. CO₂-eq: a mix of gases expressed as the CO₂ with the same GWP.
The Kaya identity
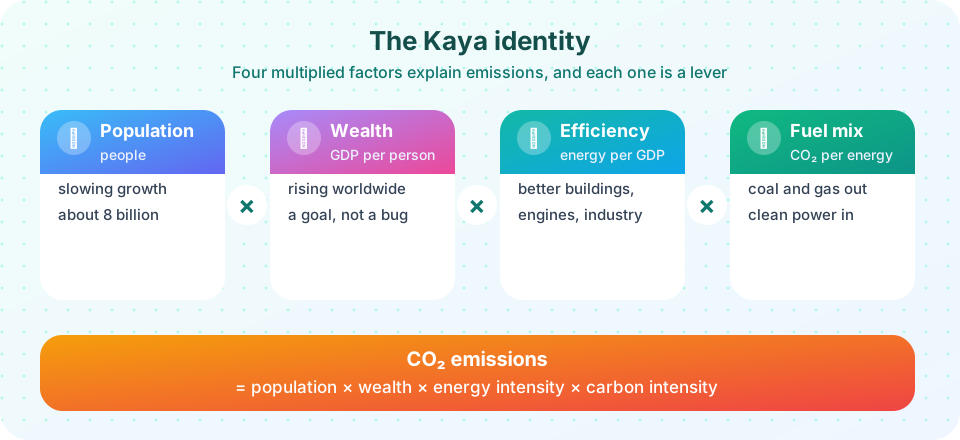
In 1990 the Japanese energy economist Yoichi Kaya proposed a simple identity. Energy-related CO₂ emissions can be written as a chain of four ratios:
CO₂ = P × (GDP / P) × (E / GDP) × (CO₂ / E)
where P is population, GDP is economic output, E is energy. In words: people × wealth per person × energy needed per unit of wealth × carbon released per unit of energy. Because it is an identity, it is true by definition (the units cancel). Its value is in organizing the discussion.
| Factor | Meaning | Direction needed | Typical levers |
|---|---|---|---|
Population P |
Number of people | Rising, then flattening | Education, health, women's empowerment (voluntary) |
Wealth GDP/P |
Output per person | Generally rising; poverty reduction is a goal | Not a lever to cut |
Energy intensity E/GDP |
Energy per unit of output | Falling | Efficiency, better buildings, industry |
Carbon intensity CO₂/E |
CO₂ per unit of energy | Falling sharply, toward zero | Replace coal, oil and gas with clean energy |
Global population is about 8 billion and still growing slowly, and billions of people want higher living standards. So the first two factors are not realistic levers for deep cuts. The burden falls on the last two, energy intensity and carbon intensity, and especially on carbon intensity, which must approach zero. Because growth rates multiply, you can simply add the percentage growth rates of the four factors for small changes to get the change in emissions.
Worked example
Suppose over a decade population grows 0.9% a year, GDP per person 2.0%, energy intensity falls 1.8% a year (−1.8), and carbon intensity falls 0.3% a year. Total: 0.9 + 2.0 − 1.8 − 0.3 = +0.8% per year, so emissions still rise. To stabilize emissions with the same growth in the first two factors, the sum of the declines in the last two must reach 2.9% per year, which is about −1.8 − 1.1. To get to zero in 30 years, carbon intensity must fall much faster than any one factor alone.
Why cumulative CO₂ matters
CO₂ is removed from the air by natural sinks in stages. A pulse of CO₂ is partly taken up by the ocean and land within decades, but a fraction of roughly 15 to 40% remains in the air for centuries, and a smaller part for many millennia. Meanwhile, as CO₂ rises, the ocean absorbs heat more slowly. These effects almost cancel in a way that gives a remarkable result: global warming is approximately proportional to cumulative CO₂ emissions, whatever the timing. The IPCC's assessed value of the TCRE is about 0.45 °C per 1000 GtCO₂ (likely range 0.27 to 0.63 °C).
Total CO₂ emissions since 1850 through 2019 were about 2,390 GtCO₂ (±240). At 0.45 °C per 1000 Gt that gives about 1.1 °C, close to the observed human-caused warming, a useful consistency check.
The remaining budget
Rearranging, the CO₂ that may still be emitted for a given temperature target is the allowed extra warming divided by TCRE, with adjustments for warming from other gases and for Earth-system feedbacks. The IPCC's Sixth Assessment Report gave estimated remaining budgets from the start of 2020:
| Target | 83% chance | 67% chance | 50% chance |
|---|---|---|---|
| 1.5 °C | 300 Gt | 400 Gt | 500 Gt |
| 2 °C | 900 Gt | 1,150 Gt | 1,350 Gt |
Human CO₂ emissions (fossil plus land use) were about 40 Gt per year in the early 2020s. So at constant emissions, the 50% budget for 1.5 °C (500 Gt from 2020) lasts about twelve years from 2020, and the 67% budget (400 Gt) about ten years. Since then several years of emissions have already been spent, so what remains is smaller still. These are approximate and depend on non-CO₂ gases, so ask how the number was defined whenever you see one quoted.
The budget framing has a policy consequence. Every year of delay uses budget, so later cuts must be steeper. It also shows that what matters is the area under the emissions curve, not the year a target is announced.
How fast must emissions fall?
If emissions fall linearly from E₀ to zero, the cumulative total is a triangle, ½ E₀ T, so the time to reach net zero is T = 2B/E₀. For a 500 Gt budget and E₀ = 40 Gt/yr that is T = 25 years. If emissions fall exponentially at rate r, the total is E₀ / r, so r = E₀ / B = 8% per year. The 2020 pandemic drop was about 5 to 6%, and it was not sustained.
Other gases and CO₂-equivalent
Methane and nitrous oxide matter too. To compare them, scientists use the global warming potential, the ratio of the warming caused by a pulse of a gas to that of the same mass of CO₂ over a chosen time. AR6 gives a GWP over 100 years (GWP-100) of about 27 to 30 for methane (29.8 for fossil methane), and about 273 for nitrous oxide. Over 20 years methane is about 80 times more potent per tonne, because it breaks down in roughly a dozen years. CO₂-equivalent is simply mass × GWP. Because methane is short-lived, pulses of methane do not accumulate like CO₂, and the carbon budget framework treats CO₂ and short-lived gases separately.
Costs, and why the picture changed
The unit costs of solar photovoltaics fell about 85% between 2010 and 2019, wind about 55%, and lithium-ion batteries about 85% (IPCC AR6 WGIII). In many places new solar or wind is now cheaper than new coal. This matters for the Kaya picture: it makes cutting carbon intensity an engineering and investment task that is increasingly affordable.
Common misconceptions
"Emissions need to fall to zero only by a deadline year." The temperature outcome depends on the cumulative amount. Reaching zero later after higher emissions means more warming.
"If emissions stop growing, warming stops." Flat emissions still add CO₂ every year. Warming only stops when net CO₂ reaches zero.
"The carbon budget is a precise number." It has a range that depends on the temperature target, the probability, non-CO₂ gases and Earth-system feedbacks.
Try it
First, the Kaya decomposition. Enter growth rates and see the net change in emissions and the required carbon intensity decline.
Press Run (or Ctrl + Enter) to see the result here.
Program input · what you'd type while the program runs
Type the answers before you press Run, one per line. Each time the program reads a line (with input()), it gets the next line from this box.
Second, a carbon budget countdown. It compares linear and exponential declines and finds the year the budget runs out.
Press Run (or Ctrl + Enter) to see the result here.
Program input · what you'd type while the program runs
Type the answers before you press Run, one per line. Each time the program reads a line (with input()), it gets the next line from this box.
Third, a CO₂-equivalent converter using AR6 GWP-100 values.
Press Run (or Ctrl + Enter) to see the console output here.
No output.
Check your understanding
Quick check · 5 questions
of 5 answered You scored / 5 · perfect!
-
1. Which Kaya factor represents the fuel mix?
CO₂ per unit of energy is the carbon intensity, set by the mix of coal, oil, gas and clean sources. -
2. Why does cumulative CO₂ matter more than the emission rate in a given year?
A large fraction of emitted CO₂ stays in the air for centuries, so warming scales with cumulative emissions. -
3. Using a 500 Gt budget and constant 40 Gt per year, how long does the budget last?
500 / 40 = 12.5 years. -
4. If emissions decline linearly to zero, the time to net zero for a budget B and current emissions E₀ is
The area under a straight line to zero is a triangle, ½ E₀ T = B, so T = 2B / E₀. -
5. What does GWP-100 of about 30 for fossil methane mean?
GWP compares the warming effect of a pulse of a gas with CO₂ over a time horizon.
Summary
- The Kaya identity splits emissions into population, wealth, energy intensity and carbon intensity; the last two are the main levers.
- Warming is approximately proportional to cumulative CO₂ (TCRE about 0.45 °C per 1000 Gt).
- AR6 gives remaining budgets from 2020 of about 500 Gt (50%) for 1.5 °C and 1,350 Gt for 2 °C.
- At about 40 Gt per year, the 1.5 °C budget is used in roughly a decade; later action means steeper cuts.
- CO₂-equivalent converts other gases using GWP; methane is potent but short-lived.
Next: The mitigation toolbox
Track your progress
Create a free account to tick off lessons and pick up where you left off on any device.
of Climate Science lessons completed