


















Lesson 22 of 48 · Climate Records and Proxies
Orbital cycles and ice ages
Learn how slow changes in Earth's orbit pace the ice ages, how amplifying feedbacks turn a small push into a 6 °C change, and how past warm periods compare with today.
For the last 2.6 million years Earth has swung between long, cold glacial periods and shorter, warmer interglacials. At the coldest point of the last ice age, about 21,000 years ago, ice sheets more than 3 km thick covered Canada and northern Europe, sea level was around 120 m lower than today, and the global mean temperature was about 6 °C lower. By 11,700 years ago the ice was in retreat and the current interglacial, the Holocene, had begun. Why does this cycle exist, and why does it have the rhythm it does?
The answer, worked out in the early 20th century and confirmed in the 1970s with deep-sea sediments, is that Earth's orbit and spin change in slow, regular ways. These changes redistribute sunlight across seasons and latitudes, and that nudges the ice sheets. In this lesson you will meet the three cycles, see how a small orbital push becomes a big climate swing and compare past climates with the present.
What you will learn
- Describe eccentricity, obliquity and precession and their periods.
- Explain why summer sunshine at high northern latitudes matters for ice sheets.
- Explain why feedbacks are needed to turn small orbital changes into ice ages.
- Compare the last glacial maximum, the last interglacial and other past climates with today.
- Compare the rate of natural climate change with the present rate.
Key terms
Eccentricity: how elliptical Earth's orbit is (0 is a circle). Obliquity: the tilt of Earth's spin axis relative to its orbit. Precession: the slow wobble of the spin axis, which shifts the season in which Earth is closest to the Sun. Insolation: sunlight arriving at the top of the atmosphere, in W/m². Last glacial maximum (LGM): the time of greatest ice extent, about 26,000 to 19,000 years ago. Holocene: the current interglacial, from 11,700 years ago.
Discovering the pacemaker
In the 1860s the Scottish scientist James Croll proposed that changes in Earth's orbit could trigger ice ages. The idea was developed in detail by the Serbian mathematician and geophysicist Milutin Milanković, who between the 1920s and 1941 calculated how much sunlight reaches each latitude in each season as Earth's orbit varies. He argued that the key quantity is the summer sunshine at high northern latitudes, because large land masses there can hold huge ice sheets. If summers are too cool to melt the snow of the previous winter, the snow accumulates and ice sheets grow. For decades the idea was disputed, as no accurate chronology of the ice ages existed. In 1976 James Hays, John Imbrie and Nicholas Shackleton analyzed oxygen isotopes in deep-sea sediment cores (lesson 4) and found cycles with periods close to those that Milanković had calculated, convincing most scientists that orbital variations are the pacemaker of the ice ages.
The three cycles
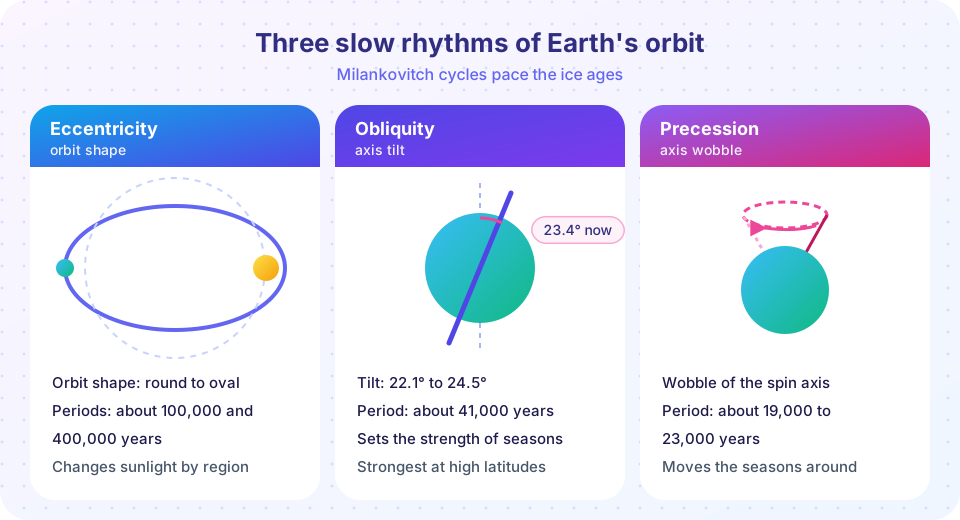
Eccentricity describes the shape of the orbit, which varies from nearly circular (e near 0.005) to somewhat elliptical (e up to about 0.06). Today it is 0.017. It cycles with periods of about 100,000 and 400,000 years. A more elliptical orbit changes the distance to the Sun and the length of seasons, but total annual sunlight reaching Earth barely changes (by less than 0.2 %), so eccentricity's main role is to modulate the effect of precession.
Obliquity is the tilt of the spin axis, which varies between 22.1° and 24.5° over about 41,000 years. It is now 23.4° and slowly decreasing. A larger tilt makes the seasons stronger: more sunlight reaches the poles in summer and less in winter. It influences high latitudes in both hemispheres, and sunlight in the polar summer especially.
Precession is the slow wobble of the spin axis, like a spinning top, combined with the slow rotation of the orbit itself. Together they shift which season occurs when Earth is closest to the Sun, with periods of about 19,000 and 23,000 years. Today Earth is closest to the Sun (perihelion) in early January, during Northern Hemisphere winter. About 11,000 years ago perihelion fell in the Northern summer, which made the summers stronger and winters weaker in the north, and helped the monsoons to be stronger and the Sahara greener.
How big are the changes?
Consider the sunshine at 65° N at the June solstice, the quantity that Milanković emphasized. Today it is around 480 W/m². Changing obliquity from its minimum to its maximum alters it by about 40 W/m² (the first TryIt computes this). Precession, when the orbit is quite elliptical, can swing it by 100 W/m² or more between perihelion in June and in December. Over the last few hundred thousand years the actual swings between extremes have been of the order of 100 W/m², a large change at that latitude and season. But when averaged over the whole globe and the year, the changes are almost zero: the orbit mostly moves sunlight around rather than adding or subtracting it. This makes the ice ages a puzzle about amplification.
From small push to ice age
The orbital forcing at a given place and season can reach tens of watts per square meter, but it cannot alone account for a 6 °C global cooling and ice sheets 3 km thick. The orbital changes are the trigger, and feedbacks are the amplifier.
- Ice-albedo feedback. When northern summers cool, snow survives and ice grows, which reflects more sunlight, which cools the area further.
- Carbon dioxide. As the climate cools, the ocean absorbs more CO₂ (colder water dissolves more gas, and changes in ocean circulation and biology store carbon in the deep sea), so CO₂ falls from about 280 to about 180 ppm. Lower CO₂ weakens the greenhouse effect and cools the planet further. Ice core records (lesson 3) show this: CO₂ and temperature move together. In a warming phase, the sequence reverses.
- Other feedbacks. Changes in dust, methane, vegetation and ice sheet shape also contribute.
The result is that a modest orbital change in sunshine, around the Northern high latitudes, is turned by a series of feedbacks into a global change of about 6 °C and a drop in sea level of about 120 m. It is a good illustration of the feedbacks and sensitivity of chapter 3: climate sensitivity derived from the last glacial maximum is one of the lines of evidence that supports the range of about 2.5 to 4 °C per CO₂ doubling.
The 100,000-year puzzle
For roughly the last 800,000 years the dominant glacial cycle has been about 100,000 years, matching the eccentricity period, but eccentricity's direct effect on sunlight is the weakest of the three. Before about one million years ago the dominant period was 41,000 years, matching obliquity. The switch, called the mid-Pleistocene transition, is still being studied. Leading explanations involve the ice sheets themselves: when they are large enough they become unstable or respond to the orbit nonlinearly, and need a few precession and obliquity cycles to build up and then collapse quickly. Declining CO₂ over millions of years may have contributed. This is a real open question, and a reminder that science describes what is well established and what is not.
Past climates as comparisons
- Last glacial maximum (about 21,000 years ago). About 6 °C colder globally (range about 5 to 7), CO₂ at about 180 ppm, sea level about 120 m lower, ice sheets over North America and northern Europe. It is a key test for models.
- The Holocene (last 11,700 years). A stable warm interglacial in which agriculture and cities developed. The warmest centuries, about 6,500 years ago, were warmer than preindustrial by a few tenths to about one degree in some reconstructions.
- Last interglacial, the Eemian (about 125,000 years ago). Global temperature was probably 0.5 to 1.5 °C above the preindustrial level, driven by orbital changes, and sea level was about 5 to 10 m higher than today as the Greenland and part of the Antarctic ice sheets lost mass. It indicates how sensitive sea level is to a warm climate.
- Mid-Pliocene warm period (about 3.3 to 3 million years ago). CO₂ near 400 ppm, comparable to today, global temperature about 2.5 to 4 °C above preindustrial, and sea level perhaps 5 to 25 m higher. It shows what the climate was like when CO₂ was at levels similar to now, long enough for the ice sheets to adjust.
- Paleocene-Eocene Thermal Maximum (about 56 million years ago). A massive release of carbon warmed the planet by around 5 °C or more over about 20,000 years, with ocean acidification and extinctions in the deep sea. The rate was much slower than the present emission rate.
Rates matter
The warming at the end of the last ice age was about 6 °C in around 6,000 to 10,000 years, which averages roughly 0.06 to 0.1 °C per century. The observed warming since 1850 is about 1.1 °C in 170 years, roughly 0.65 °C per century, and recently about 0.2 °C per decade. The current rate is thus about ten times faster than the average rate at the end of the last ice age. And while ice age warming was largely driven by CO₂ released from the ocean in response to orbital changes, today the carbon is being added directly, from fossil fuels.
The next ice age
Without human influence, the orbit predicts that the next glacial inception would be at least tens of thousands of years from now, since the present orbit has low eccentricity and a particular pattern of obliquity and precession. With human CO₂ added to the atmosphere, simulations (such as those by Ganopolski and colleagues in 2016) indicate that the onset of the next ice age is likely to be delayed by at least 50,000 years, and that large emissions could cancel an entire glacial cycle. An ice age is not a threat on human time scales; the concern is the pace of warming.
Common misconceptions
"Orbital cycles prove current warming is natural." Orbital cycles act slowly (tens of thousands of years) and, at present, they are nudging the Earth very gently toward cooling over thousands of years. They cannot explain a warming of 1.1 °C in 150 years, which matches the observed rise in greenhouse gases.
"Ice ages were caused by CO₂ alone." They were triggered by orbital changes and amplified by CO₂, ice-albedo and other feedbacks. This is a clear example of climate feedbacks, not an argument against greenhouse gas physics.
"Milankovitch theory predicts exactly when the next ice age begins." It shows when conditions are favorable; the actual outcome depends on CO₂ and ice-sheet dynamics.
Try it
The first example computes sunshine at 65° N at the June solstice for extreme orbital settings, using the standard formula for daily insolation.
Press Run (or Ctrl + Enter) to see the result here.
Program input · what you'd type while the program runs
Type the answers before you press Run, one per line. Each time the program reads a line (with input()), it gets the next line from this box.
The second example creates a synthetic orbital signal from sinusoids with the periods above and uses a periodogram to recover the periods, which is how Hays, Imbrie and Shackleton recognized the cycles in sediment records.
Press Run (or Ctrl + Enter) to see the result here.
Program input · what you'd type while the program runs
Type the answers before you press Run, one per line. Each time the program reads a line (with input()), it gets the next line from this box.
The third example is an orbit playground. Set the eccentricity, tilt and the time of year when Earth is nearest the Sun, and read off the June solstice sunshine at your chosen latitude.
Check your understanding
Quick check · 6 questions
of 6 answered You scored / 6 · perfect!
-
1. Which orbital cycle has a period of about 41,000 years?
Axial tilt (obliquity) varies between 22.1° and 24.5° with a period of about 41,000 years. -
2. Why did Milanković focus on summer sunshine at high northern latitudes?
Ice sheets grow when snow survives the summer on land at high latitudes. -
3. Why are feedbacks needed to explain the ice ages?
Feedbacks such as ice-albedo and lower CO₂ amplified the orbital push into a global change. -
4. How does the present rate of warming compare with the average rate at the end of the last ice age?
About 0.65 °C per century (and recently faster) versus about 0.06 to 0.1 °C per century in the last deglaciation. -
5. During the last glacial maximum, global temperature was about:
Reconstructions give about 6 °C (range 5 to 7) cooler than preindustrial, with sea level about 120 m lower. -
6. What do recent studies say about the onset of the next ice age with high CO₂?
Model studies indicate that high CO₂ postpones the next glacial inception by tens of thousands of years or more.
Summary
- Eccentricity (about 100,000 and 400,000 years), obliquity (41,000 years) and precession (19,000 to 23,000 years) pace the ice ages by changing the distribution of sunshine.
- Summer insolation at high northern latitudes decides whether ice sheets grow; the changes reach about 100 W/m² between extremes but are almost zero in the global annual mean.
- Feedbacks (ice-albedo, CO₂ drawn down to about 180 ppm, others) amplify the push into a 6 °C cooling and a 120 m sea-level fall.
- Past warm periods (Eemian, Pliocene) show how sea level and temperature respond to warmer climates over long times; present warming is roughly ten times faster than the last deglaciation.
- High CO₂ is likely to delay the next ice age by at least about 50,000 years.
Track your progress
Create a free account to tick off lessons and pick up where you left off on any device.
of Climate Science lessons completed