


















Lesson 3 of 48 · Getting Started
How botanists work
Learn how plant scientists ask questions, design fair experiments with controls and replicates, use tools from hand lenses to herbaria, and read their results.
Botany is not a list of facts to memorize. It is a way of finding out what plants do, and why. The same loop of observing, asking, testing and revising produced everything in this course, from the discovery that plants make their own food to the plants engineered to resist disease. In this lesson you will learn that loop, the tools botanists use and how to read the numbers an experiment produces.
What you will learn
- The steps of a plant experiment, from observation to analysis.
- What variables, controls and replicates are, and why each matters.
- How to compute and read a mean and a standard deviation.
- The main tools of the field and lab, including herbarium specimens and microscopes.
- How early experiments such as van Helmont's showed where plant mass comes from.
Key terms
- Hypothesis: a specific, testable explanation, such as "plants in shade make less chlorophyll".
- Independent variable: the factor you change on purpose (light level).
- Dependent variable: the factor you measure in response (chlorophyll content).
- Control: a group treated the same way except for the factor under test.
- Replicate: one of several repeated samples, needed to separate real effects from chance.
A worked example
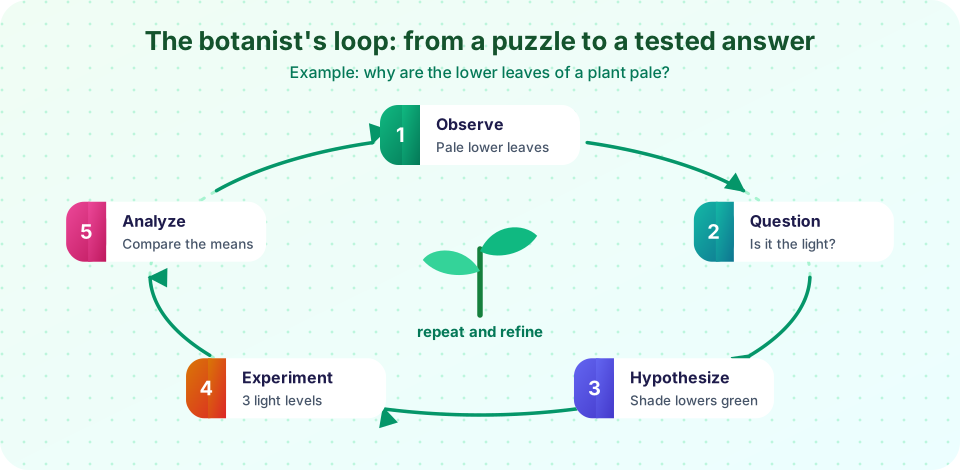
Suppose you notice that the lower leaves of a houseplant are paler than the upper ones. That is an observation. The natural question is "why?" Many answers are possible: less light, less water, old age, a nutrient shortage. A hypothesis picks one and makes a prediction that could turn out wrong: "Leaves that receive less light contain less chlorophyll, so they look paler."
An experiment tests the hypothesis. You grow 30 identical bean seedlings in three groups of 10:
| Group | Light (relative) | Role |
|---|---|---|
| A | 100 percent (full light) | the control |
| B | 50 percent | treatment 1 |
| C | 10 percent | treatment 2 |
You keep everything else the same: the soil, the pot size, the water given, the temperature and the number of days. The factor you change on purpose is the independent variable (light). The factor you measure is the dependent variable, for example the chlorophyll content of the third leaf, measured with a leaf-color meter or by extracting the pigment in alcohol and measuring how much light it absorbs.
Three ideas make the experiment trustworthy.
- A control. Group A shows what happens with no change. Without it you cannot tell whether the treatment did anything.
- Replicates. Individual plants vary: no two seedlings are identical. Ten plants per group let you see the typical value and the spread.
- Only one thing changes. If group C were also grown in a warmer room, you could not tell whether light or heat caused the effect. Confounded variables are a classic reason that experiments fail.
Randomization helps too. Do not put the shaded plants on the cooler shelf by the window; assign the pots to positions at random.
Reading the numbers: mean and spread
Suppose the leaf chlorophyll readings in group C are 18, 21, 19, 24 and 20 (in arbitrary meter units). The mean is the sum divided by the count: (18 + 21 + 19 + 24 + 20) / 5 = 20.4. The standard deviation measures the typical distance from the mean. Here it is about 2.3 units (using the sample formula with n − 1 in the denominator). A small spread compared with the gap between groups suggests a real effect; a large spread suggests that chance could explain the difference.
Statistical tests such as the t-test or analysis of variance (ANOVA) turn this reasoning into a p-value: the probability of seeing a difference at least this large if the treatment had no effect. A small p-value (conventionally below 0.05) is evidence against "no effect", not proof of the hypothesis. A good botanist also reports the size of the effect, not only whether it passed a threshold.
The tools of the trade
- Hand lens and field notebook. A 10x lens reveals hairs, glands and flower parts. Notes with the date, place and habitat are what make a record scientifically useful.
- Herbarium. A herbarium is a library of pressed, dried and labeled plant specimens. Some are over 300 years old. They show where and when species lived, and their DNA can still be sequenced. Each name is tied to a type specimen.
- Light microscope. Magnifies up to about 1000x. Total magnification is the eyepiece power times the objective power: 10x with 40x gives 400x.
- Electron microscopes. Reveal cell walls and organelles at nanometer scale.
- Growth chambers and greenhouses. Control light, temperature and humidity so that one factor can be changed at a time.
- Spectrophotometer and gas analyzers. Measure pigments and the rate of photosynthesis from carbon dioxide uptake.
- DNA sequencing. Reads genes to place species on the tree of life and find genes for traits such as drought tolerance.
Field and lab work complement each other. A field study shows what plants do in nature, but many things change at once. A lab experiment isolates one factor, but the setting is artificial. Strong conclusions come from both.
Famous plant experiments
Van Helmont's willow (about 1640). Jan Baptist van Helmont planted a 5-pound willow shoot in 200 pounds of dried soil, watered it for five years and found a 169-pound tree and almost no loss of soil. He concluded that the tree was made of water. He missed the role of air, but he showed that soil does not make up the plant's mass.
Priestley and Ingenhousz (1770s). Joseph Priestley found that a sprig of mint could "restore" air in which a candle had burned out. Jan Ingenhousz repeated the work and showed that it needed sunlight and only worked with the green parts. This was the discovery that plants release oxygen in the light.
Mendel's peas (1850s-60s). Gregor Mendel crossed pea plants, counted thousands of offspring and found patterns that became the basis of genetics. His strength was careful design and large samples.
Notice the pattern: each experiment had a clear question, a controlled comparison and a number to measure.
Common misconceptions
- "An experiment proves the hypothesis." Experiments can support a hypothesis or contradict it, but one result does not prove it for all cases. Scientists build confidence through repetition by other groups.
- "A correlation shows a cause." Tall plants may have more flowers, but both could be caused by more fertilizer. Only a controlled change reveals a cause.
- "A control group is a plant that gets no treatment at all." A control receives the standard conditions. A plant "with no water" is a different treatment, not a control.
Try it
Press Run (or Ctrl + Enter) to see the result here.
Program input · what you'd type while the program runs
Type the answers before you press Run, one per line. Each time the program reads a line (with input()), it gets the next line from this box.
Press Run (or Ctrl + Enter) to see the console output here.
No output.
Check your understanding
Quick check · 5 questions
of 5 answered You scored / 5 · perfect!
-
1. In the light experiment, what is the independent variable?
The independent variable is what you change on purpose; chlorophyll is what you measure (dependent). -
2. Why are there ten seedlings in each group instead of one?
Plants vary, so replicates are needed to separate a real effect from chance. -
3. The mean of 18, 21, 19, 24 and 20 is...
The sum is 102 and 102 / 5 = 20.4. -
4. Van Helmont's willow gained about 164 pounds and the soil barely changed. His conclusion that the tree was made of water was...
He showed the mass did not come from soil, but the carbon in the wood came from carbon dioxide in air. -
5. A herbarium specimen is useful because it...
Pressed, labeled specimens document where and when a plant grew and can be studied again, even by DNA.
Summary
- Botanists observe, ask a question, form a testable hypothesis, run a controlled experiment and analyze the data.
- A good design has one changed factor, a control and replicates, ideally with random placement.
- The mean and standard deviation summarize results; a statistical test asks whether chance could explain a difference.
- Tools range from hand lens and herbarium to microscopes, gas analyzers and DNA sequencers.
- Classic experiments (van Helmont, Priestley and Ingenhousz, Mendel) each combined a clear question with something measurable.
Track your progress
Create a free account to tick off lessons and pick up where you left off on any device.
of Botany and Plant Science lessons completed