


















Lesson 14 of 47 · Analysis of Statically Determinate Structures
Shear force and bending moment diagrams
Draw shear force and bending moment diagrams for beams: sign conventions, the relations dV/dx = −w and dM/dx = V, worked examples, overhangs and a runnable beam solver.
A beam carries load by developing internal forces. At every section, the material to one side pushes on the material to the other with a shear force V that tries to slide the sections past each other, and a bending moment M that tries to curve the beam. The shear force diagram (SFD) and bending moment diagram (BMD) show how V and M vary along the beam. The largest values size the beam, so these diagrams are the heart of structural design.
What you will learn
- The sign conventions for V and M.
- How to draw diagrams by cutting the beam (the method of sections).
- The shortcut relations between load, shear and moment.
- How to handle point loads, uniform loads, overhangs and applied moments.
Key terms
Shear force (V): the internal force perpendicular to the beam's axis at a section. Bending moment (M): the internal moment at a section. Sagging moment: positive moment that makes the beam curve like a smile, tension at the bottom. Hogging moment: negative moment, tension at the top. Point of contraflexure: a point where M changes sign.
Sign conventions
Conventions vary between textbooks. This course uses the common one:
- Shear V is positive when the left face of a cut moves up relative to the right face. Equivalent rule: V at a section is the sum of all vertical forces to the left of it, with upward forces positive.
- Bending moment M is positive when it causes sagging (tension in the bottom fibres). M at a section is the sum of the moments of all forces to the left about the section, with upward forces on the left giving positive moments.
- Diagrams are drawn with positive shear up. Moment diagrams in structural engineering are drawn on the tension side, so a sagging (positive) moment is plotted downward. That puts the diagram on the side of the beam where the reinforcement or bottom flange has to resist tension. Some textbooks plot positive moment upward; know which one you are looking at.
The method of sections
To find V and M at x:
- Find the reactions.
- Cut the beam at x and keep the left piece.
- V(x) = sum of vertical forces on the left piece (up positive).
- M(x) = sum of moments about the cut of forces on the left piece.
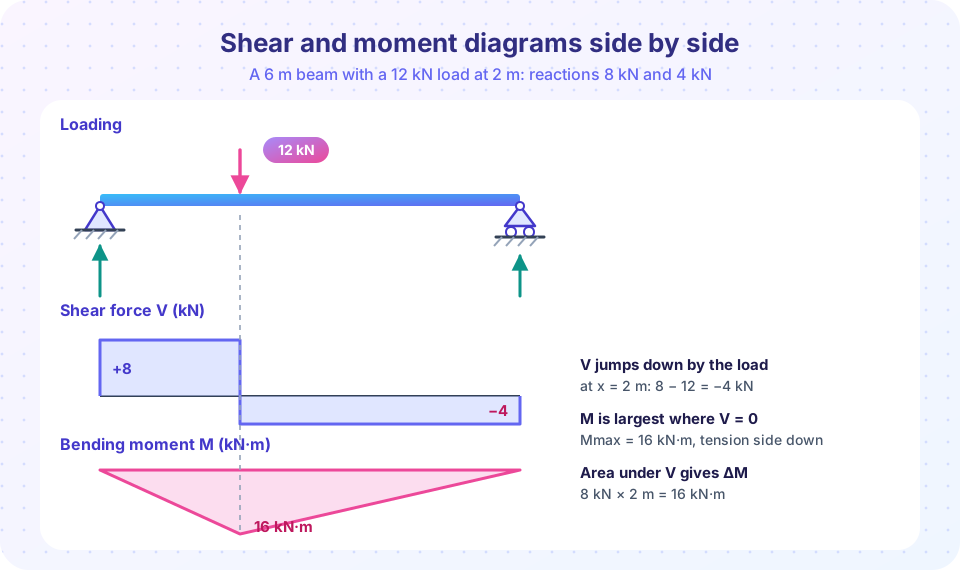
For the 6 m beam in the figure (reactions 8 kN at A and 4 kN at B, load 12 kN at x = 2 m):
- 0 < x < 2: V = 8 kN, M = 8x. At x = 2, M = 16 kN·m.
- 2 < x < 6: V = 8 − 12 = −4 kN, M = 8x − 12(x − 2) = 24 − 4x. At x = 6, M = 0 ✓.
Relations between load, shear and moment
Take a small slice of beam of length dx with distributed downward load w(x). Vertical balance gives dV = −w dx; moment balance gives dM = V dx. So:
dV/dx = −w        dM/dx = V
V(b) − V(a) = −(area under the load between a and b)
M(b) − M(a) = +(area under the shear diagram between a and b)
These tell you the shape of the diagrams without calculation:
| Load | Shear V | Moment M |
|---|---|---|
| None | constant | straight line |
| Uniform w | straight, slope −w | parabola |
| Point load P down | jumps down by P | kink (slope changes) |
| Applied couple M0 | no change | jumps by M0 |
| V = 0 | M has a maximum or minimum |
The last row is the most useful: the maximum moment occurs where the shear passes through zero.
Worked example: uniform load
A simply supported beam of span 6 m carries w = 10 kN/m. Reactions: 30 kN each. V(x) = 30 − 10x, going from +30 to −30. V = 0 at x = 3 m. M(x) = 30x − 5x², so Mmax = 30 × 3 − 5 × 9 = 45 kN·m, which equals wL²/8 = 10 × 36 / 8 ✓. Check with areas: the triangle of shear from 0 to 3 m has area ½ × 30 × 3 = 45.
Worked example: overhang
Return to the overhanging beam of lesson 140: pin at A (x = 0), roller at B (x = 6 m), tip C at x = 8 m, 10 kN/m over AB and 20 kN at C. Reactions: Ay = 23.33 kN, By = 56.67 kN.
- V starts at +23.33 kN, falls at 10 kN per metre, and reaches 23.33 − 60 = −36.67 kN just left of B.
- At B it jumps up by 56.67 kN to +20 kN and stays at 20 kN to C, where the tip load pulls it to 0 ✓.
- V = 0 at x = 2.33 m, so Mmax (sagging) = 23.33 × 2.33 − 5 × 2.33² = 27.2 kN·m.
- M at B = 23.33 × 6 − 5 × 36 = −40 kN·m (hogging), and from B to C the shear is +20, so M rises by 20 × 2 = 40 to reach 0 at the free tip ✓.
The moment changes sign between the two peaks. The point where M = 0 is a point of contraflexure, here at about x = 4.67 m. At that point the beam's curvature reverses, and reinforcement placement or flange bracing changes.
Press Run (or Ctrl + Enter) to see the result here.
Program input · what you'd type while the program runs
Type the answers before you press Run, one per line. Each time the program reads a line (with input()), it gets the next line from this box.
The printed numbers reproduce the hand calculation: Ra = 23.33, Rb = 56.67, sagging 27.2 kN·m and hogging −40 kN·m. Edit the loads to try your own beams, for example [(2, 12)], [], 0, 6 is the beam in the figure at the top of the lesson.
Reading a moment diagram
A moment diagram is a map of how the beam wants to curve. Where M is positive, the bottom is in tension; where negative, the top is. That tells you where to place reinforcement in concrete, where to brace the compression flange in steel, and where deep sections or cover plates are needed. The shape also hints at deflection: the beam curves most where |M| is largest.
Notice that the peak moment is largest when the load is at midspan (18 kN·m) and shrinks toward the supports: a load near a support is mostly carried straight into that support.
Common misconceptions
"Maximum shear and maximum moment occur at the same place." Usually they do not. The maximum moment is where shear is zero, and shear is typically largest at supports.
"A kink in the shear diagram means an error." Shear should step at point loads and reactions. Only the moment diagram is continuous at point loads (unless an applied couple acts there).
"Positive and negative moment are interchangeable." The sign says which face is in tension, which determines where the reinforcement or flange goes.
Check your understanding
Quick check · 5 questions
of 5 answered You scored / 5 · perfect!
-
1. Where does the maximum bending moment occur on a simply supported beam?
dM/dx = V, so M has a maximum or minimum where V = 0. -
2. A simply supported beam of span 8 m carries 5 kN/m. What is Mmax?
wL²/8 = 5 × 64 / 8 = 40 kN·m. -
3. What happens to the shear diagram at a point load of 15 kN acting downward?
Using the left-to-right rule, a downward force reduces the sum of vertical forces to its left. -
4. Under a uniform load, the moment diagram is
V is linear, and M is the integral of V, so a quadratic curve results. -
5. The area under the shear diagram between two points equals
M(b) − M(a) = ∫V dx.
Summary
- V is the sum of vertical forces on one side; M is the sum of their moments about the cut.
- dV/dx = −w and dM/dx = V; point loads step V, applied couples step M.
- Maximum |M| occurs where V = 0 (or at a free end or support with a couple).
- Overhangs create hogging moments over the support; M changes sign at a point of contraflexure.
- Draw M on the tension side so it shows where the reinforcement or flange must work hardest.
Track your progress
Create a free account to tick off lessons and pick up where you left off on any device.
of Structural Engineering lessons completed