


















Lesson 31 of 47 · Renewables and Storage
Chapter 7 overview: renewables and storage
See how wind, solar and batteries change a power system: variable output, inverter-based interfaces and the duck curve, plus a map of the chapter's lessons.
For a century a power system was built around machines that could be told what to do: burn more fuel, open the gates, produce more power. Wind and solar break that rule. Their output follows the weather, they connect to the grid through power electronics instead of spinning generators, and they are usually small and spread out rather than big and central. They are also very cheap to run, because the fuel is free. The challenge of the next decades is to build a system that uses this cheap, clean energy without losing the reliability the previous chapters taught you to protect.
This chapter covers how solar panels and wind turbines convert energy, how inverters connect them to the grid, and how storage fills the gaps.
What you will learn
- Describe how variable renewables differ from conventional generation.
- Read a duck curve and explain the ramp and over-generation problems.
- Name the main sources of flexibility.
- Know what each lesson in the chapter covers.
Key terms
Variable renewable energy (VRE): wind and solar generation, whose output depends on weather and time of day.
Capacity factor: actual energy produced over a period divided by the energy at continuous rated power.
Net load: demand minus wind and solar output; what the rest of the system must supply.
Curtailment: deliberately reducing renewable output because the grid cannot use it.
Flexibility: the ability of the system to adjust supply or demand quickly to follow net load.
The big picture
What is different
What it stresses
What helps
Energy versus capacity
A 100 MW gas plant can deliver 100 MW whenever it is asked. A 100 MW solar farm delivers its rated power only around midday in clear weather; over a year its capacity factor might be 15 to 30 % depending on location and tracking. A good onshore wind farm lies roughly between 25 % and 45 %, and offshore wind often reaches higher. So 100 MW of solar produces perhaps 20 to 25 MW on average, and replacing 100 MW of firm capacity needs more than 100 MW of wind and solar plus something to cover calm, dark hours. Planners therefore distinguish energy (MWh over a year) from firm capacity (MW available at the time of peak demand).
The duck curve
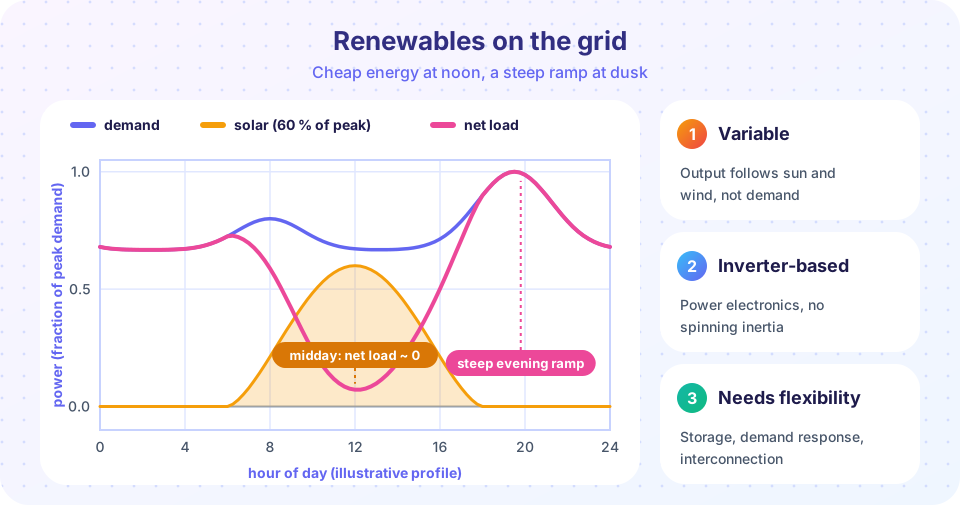
Subtract solar output from demand and you get the net load that conventional plants must serve. With lots of solar, net load is very low at midday and then climbs steeply as the sun sets while evening demand peaks. The silhouette looks like a duck, which is why grid operators in California coined the name. Two problems appear:
- Over-generation at midday: if net load falls below the minimum power that thermal plants must keep running, renewable output must be curtailed, or exported, or stored. Electricity prices can even turn negative.
- Steep ramps: in the evening, other resources must increase by several percent of peak demand per hour. The faster the ramp, the more flexible plants are needed.
Flexibility
The system can respond in four ways. Storage moves energy from the surplus period to the shortage. Transmission and interconnection averages out variability over wider areas, since the wind is rarely calm everywhere at once. Demand response shifts flexible loads (water heating, electric vehicle charging, industrial processes) into the hours of surplus. Flexible generation (hydropower, gas turbines, modern coal and nuclear with ramping capability) fills what remains. Forecasting of wind and solar makes all of these cheaper, because the cost of flexibility depends on how well the shortage is predicted.
Your route through the chapter
- Solar and wind power: how a PV module and a wind turbine convert energy, maximum power point tracking, the cube law and capacity factors.
- Inverter-based resources and grid codes: grid-following and grid-forming control, fault ride-through, inertia and weak grids.
- Energy storage: technologies, power versus energy, efficiency, and economic sizing.
- Chapter 7 review: a cheat sheet, a recap table and a ten-question quiz.
Common misconceptions
"Renewables make the grid unreliable." Variability is a design problem with known solutions; many systems already run for hours on mostly wind and solar. The cost lies in the flexibility and network investment needed.
"Capacity factor measures efficiency." It measures how much of the time the plant produces at full power on average; it says nothing about how well sunlight or wind is converted.
"Solar and wind are always cheaper than anything else on the grid." Their energy is cheap, but the system value falls as their share grows, because everything produces at the same time. Storage and flexibility cost money.
Try it
The first example builds the duck curve from simple formulas for demand and solar output (illustrative shapes, not measured data). It adds solar equal to 0, 30, 60 and 90 % of peak demand and reports the lowest net load and the steepest three-hour evening ramp.
Press Run (or Ctrl + Enter) to see the result here.
Program input · what you'd type while the program runs
Type the answers before you press Run, one per line. Each time the program reads a line (with input()), it gets the next line from this box.
The second example is an interactive duck curve. Move the solar share and see the net load, the lowest value and the steepest three-hour ramp.
Check your understanding
Quick check · 5 questions
of 5 answered You scored / 5 · perfect!
-
1. A 50 MW solar farm produces 100,000 MWh in a year. What is its capacity factor?
Full-power energy = 50 MW x 8,760 h = 438,000 MWh. 100,000 / 438,000 = 0.228, or about 23 %. -
2. What is net load?
Net load is what dispatchable generation, storage and imports must supply. -
3. Which feature produces the neck and belly of the duck curve?
Midday solar pulls net load down; its fast fall at sunset combined with the evening peak gives a steep ramp. -
4. Which of these is NOT a source of flexibility?
Capacity factor is a result of the resource and the technology; it is not a flexibility resource. -
5. Why does the system value of solar tend to fall as its share grows?
High simultaneity of output creates surplus at those hours.
Summary
- Wind and solar are weather-driven, inverter-based, often distributed and cheap to operate.
- Capacity factor links installed power to energy:
CF = annual energy / (rated power × 8,760 h). - Net load (demand minus wind and solar) shows the duck curve: midday surplus and a steep evening ramp.
- Flexibility comes from storage, interconnection, demand response, flexible generation and forecasting.
- The next lessons look at the conversion physics, the inverter interface and storage.
Next: Solar and wind power
Track your progress
Create a free account to tick off lessons and pick up where you left off on any device.
of Electric Power Systems lessons completed