


















Lesson 43 of 47 · Projects and Practice
Project 2: sizing a solar-battery-diesel microgrid
Simulate a day of a solar, battery and diesel microgrid, sweep PV and battery sizes, estimate annual cost, fuel use and renewable share, and check how long critical loads can be served.
A remote clinic, a campus and a small island all face the same question: how much solar and how much battery should we buy so that the diesel generator runs as little as possible, without spending more on equipment than we save on fuel? There is no single right answer, because the answer depends on prices, sunshine and what the owner values. What engineers can do is build a simulation, sweep the choices and show the trade-off.
This project builds exactly that model: an hourly (here quarter-hourly) energy balance with simple dispatch rules, followed by a sweep over PV and battery sizes and a rough annualized cost.
What you will learn
- Build an energy-balance simulation with a battery and a backup generator.
- Compute renewable share, diesel energy, curtailment and battery use.
- Sweep component sizes and combine the results with a simple cost model.
- Check resilience: how long can critical loads be served when islanded?
Key terms
Energy balance: in every time step, generation plus battery discharge equals load plus battery charge plus curtailment.
Renewable share: the fraction of the load energy that does not come from diesel.
Curtailment: solar energy that cannot be used or stored and is wasted.
State of charge (SoC): battery energy as a fraction of its capacity.
Annualized cost: capital cost times the capital recovery factor, plus yearly operating cost.
The model
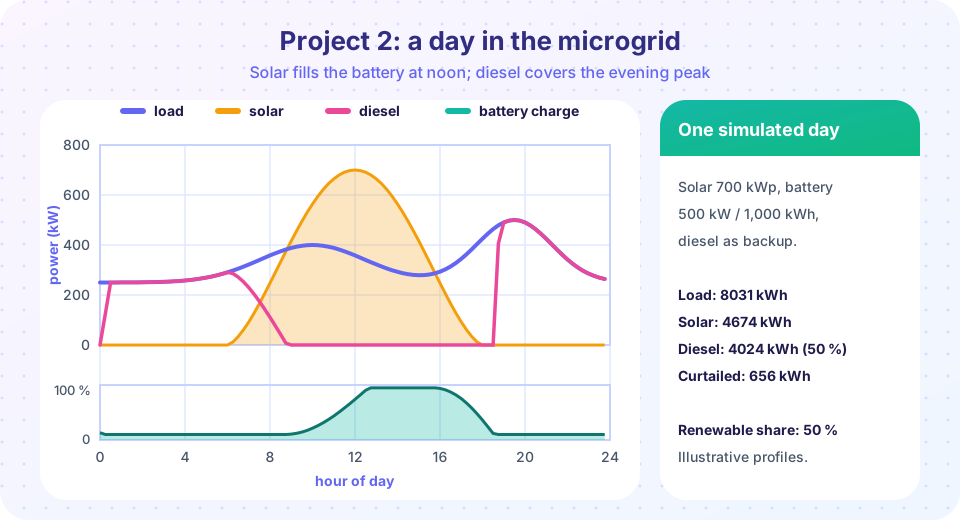
The microgrid serves a campus with a load of about 250 kW at night, a daytime bulge and an evening peak of 500 kW. A PV plant of size Ppv (kW peak) produces Ppv × s(t), where s(t) is a normalized sun profile. A battery has power Pb (kW) and energy Eb (kWh), one-way efficiency 94 % (88 % round trip) and an operating window of 10 % to 95 % SoC. A diesel generator, large enough for the whole load, backs everything up. The profiles are illustrative, not measured.
Dispatch rules (evaluated in every 15-minute step Δt):
- If PV exceeds the load, the surplus charges the battery, limited by its power rating and by the room left in the battery (
0.95·Ebminus the present energy, divided by the efficiency andΔt). Whatever cannot be stored is curtailed. - If the load exceeds PV, the battery discharges to cover the deficit, limited by its power and by the energy above the 10 % reserve. The remainder is covered by diesel.
This "solar first, battery second, diesel last" rule is simple and often close to optimal for fuel use. Real controllers also keep spinning reserve (so that a cloud does not trip the system), respect the diesel's minimum load (often 30 % of rating) and may charge the battery from diesel in advance of a forecast shortfall; the model leaves these out.
Cost model
Using illustrative prices: PV at 1,000 $/kW (20 years), battery at 400 $/kWh including its inverter (12 years), an 8 % discount rate, diesel fuel at 1.10 $/L and 0.28 L/kWh. The capital recovery factor is CRF = r(1 + r)^n/((1 + r)^n − 1): 0.102 for PV and 0.133 for the battery. The annual cost is
cost = Ppv × 1,000 × CRF_pv + Eb × 400 × CRF_batt + (diesel kWh per day × 365) × 0.28 × 1.10
For a diesel-only system the cost is just the fuel: about 8,031 kWh a day × 365 × 0.308 $/kWh ≈ 0.90 million dollars per year. Adding solar and storage trades fuel for capital.
What the sweep shows
With these assumptions the cheapest combination in the grid is about 900 kW of PV and a 3,000 kWh battery: renewable share 74 %, diesel energy down to roughly 2,080 kWh per day and an annual cost near 485 thousand dollars, much less than the diesel-only case. The cost curve is flat near the optimum: 1,100 kW and 4,000 kWh costs only about 12 thousand dollars more per year and lifts the renewable share to 81 %. This is typical. The economic optimum is a broad plateau, so the owner can buy more renewable share for little extra money. The result is sensitive to fuel price, battery cost and the load shape, so the sensitivity is more informative than the single "best" point.
Resilience
For a clinic the key question is not annual cost but how long can critical loads be served if fuel deliveries stop? Suppose the critical load is 150 kW and the diesel tank holds 5,000 L. At 0.28 L/kWh that is 5,000/0.28 ≈ 17,860 kWh, or about 119 hours at 150 kW. Solar and battery stretch that: by the evening the battery can supply the critical load for several hours with no fuel at all. The design may therefore reserve part of the battery for critical loads rather than economic dispatch, and size the diesel and fuel storage for the worst-case multi-day autonomy.
Limits of the model
A single repeated day ignores seasons and weather runs (a week of clouds is the real design case), battery degradation, generator minimum load and start-up, spinning reserve and the electrical dynamics of an island (a battery inverter must be grid-forming; see chapter 7). A full study would use a year of measured hourly data and a dedicated optimizer, but the structure is the same as the model here.
Common misconceptions
"The best system is the one with the lowest cost per kWh of solar." What matters is the cost of the whole system serving the load, including storage and fuel.
"More battery always improves renewable share." Beyond the point where solar cannot fill it, extra battery is unused; the sweep shows diminishing returns.
"100 % renewable is just a bigger version of 80 %." The last percentages need seasonal storage or much oversized plants, which is why a small diesel or other firm source often remains.
Try it
The first example simulates a day with a 700 kW PV plant and a 500 kW / 1,000 kWh battery, prints the energy totals and plots the power flows and the state of charge.
Press Run (or Ctrl + Enter) to see the result here.
Program input · what you'd type while the program runs
Type the answers before you press Run, one per line. Each time the program reads a line (with input()), it gets the next line from this box.
The second example sweeps PV size and battery capacity (battery power is half of the capacity, a two-hour battery), computes the annualized cost and renewable share, and shows the cost map.
Press Run (or Ctrl + Enter) to see the result here.
Program input · what you'd type while the program runs
Type the answers before you press Run, one per line. Each time the program reads a line (with input()), it gets the next line from this box.
The third example is an interactive sizing tool with the same model: move the PV size and the battery capacity and read the diesel energy, renewable share and annual cost.
Check your understanding
Quick check · 5 questions
of 5 answered You scored / 5 · perfect!
-
1. In the dispatch rule, what happens to solar surplus that cannot be stored?
Energy beyond the load and the battery's power or capacity limits is wasted (curtailed). -
2. A microgrid uses 8,000 kWh a day and diesel supplies 2,000 kWh. What is the renewable share?
Share = 1 - 2,000/8,000 = 0.75. -
3. At 0.28 L/kWh, how much fuel does a diesel generator use to supply 2,000 kWh?
2,000 x 0.28 = 560 L. -
4. Why is the cost map near the optimum described as flat?
Saved fuel offsets extra capital near the optimum, giving a broad plateau. -
5. Which important effect is missing from a single-day model?
Resilience and sizing are often governed by multi-day low-sun periods.
Summary
- A microgrid model balances energy every time step: solar first, battery second, diesel last.
- The outputs are renewable share, diesel energy and fuel, curtailment and battery use.
- Sweeping sizes with an annualized cost model finds a broad optimum; extra renewable share is cheap near it.
- Resilience is governed by critical load, battery reserve and fuel autonomy rather than by annual cost.
- Real studies add seasons, degradation, reserve, minimum load and dynamic performance.
Next: Practice problems
Track your progress
Create a free account to tick off lessons and pick up where you left off on any device.
of Electric Power Systems lessons completed