


















Lesson 8 of 47 · Polymer Basics
Molar mass and its distribution: Mn, Mw and dispersity
Learn why a polymer sample has a distribution of chain lengths, how to calculate Mn, Mw and dispersity, and why the different averages matter for properties.
Imagine measuring the height of every adult in a city and being asked for "the" height. You would give an average, and you would probably add how much people vary. A polymer sample is the same problem with a twist: there are many ways to average, and they give different answers. A sample can have a number-average molar mass of 50,000 g/mol and a weight-average of 83,000 g/mol, and both numbers are correct. Understanding why, and which one to use, is one of the most useful skills in polymer science, because molar mass controls strength, viscosity, processing and recycling.
What you will learn
- Why polymers have a distribution of chain lengths
- How to calculate the number-average (Mn), weight-average (Mw) and z-average (Mz) molar masses
- What dispersity means and what values are typical
- How molar mass affects properties such as strength and melt viscosity
Key terms
Number-average molar mass (Mn): total mass of the sample divided by the number of chains; every chain counts equally.
Weight-average molar mass (Mw): an average that weights each chain by its mass, so heavy chains count more.
Dispersity (Đ, also PDI): the ratio Mw/Mn; equal to 1 only when all chains are identical.
Molar mass distribution (MMD): the curve showing how much of the sample lies at each chain length.
Oligomer: a short chain, a handful to a few dozen repeat units.
Why chains differ in length
Chain growth is a game of chance. In step-growth, any two ends can meet at any time, so some molecules grow early and others stay small. In radical polymerization, a chain adds monomers until a termination event happens at random. In both cases the outcome for one chain is probabilistic, and a sample contains trillions of chains with a spread of lengths. Only special methods (living polymerization, chapter 3) give chains that are almost the same length. Natural polymers can be exactly uniform: every molecule of a particular protein has the same sequence and mass. Synthetic polymers rarely are.
So we describe a sample by a distribution and summarize it with averages.
The averages
Suppose a sample has Nᵢ chains of molar mass Mᵢ.
- Number average:
Mn = Σ NᵢMᵢ / Σ Nᵢ. It is the plain arithmetic mean over chains. Every molecule has an equal vote. - Weight average:
Mw = Σ NᵢMᵢ² / Σ NᵢMᵢ. Each chain's vote is proportional to its mass, so large chains dominate. - z-average:
Mz = Σ NᵢMᵢ³ / Σ NᵢMᵢ², even more sensitive to the largest chains. - Viscosity average
Mvlies between Mn and Mw (closer to Mw) and comes from viscosity measurements.
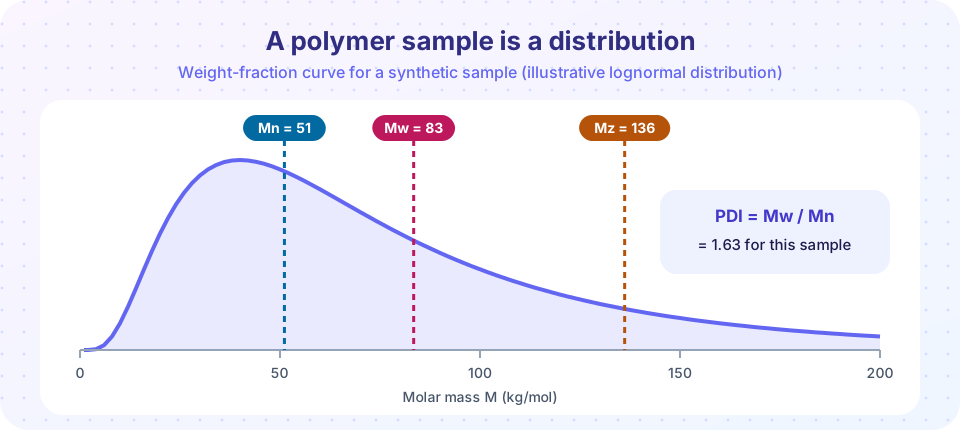
Always Mn ≤ Mv ≤ Mw ≤ Mz. They are equal only if all chains have the same mass. The dispersity is
Đ = Mw / Mn ≥ 1.
Older books call it the polydispersity index (PDI); IUPAC recommends dispersity, symbol Đ. A value near 1 means a narrow distribution; commercial polymers from radical polymerization are often 1.5 to 3, step-growth polymers about 2 and well-controlled living polymerizations 1.05 to 1.3. Catalysts with many different active sites can give broad distributions, with Đ of 4 to 8 or more.
Worked example. A tiny sample contains 3 chains of 10,000 g/mol, 2 chains of 50,000 g/mol and 1 chain of 100,000 g/mol.
- Total mass = 3(10,000) + 2(50,000) + 1(100,000) = 230,000 g/mol (in units per six chains)
- Mn = 230,000 / 6 = 38,333 g/mol
- ΣNᵢMᵢ² = 3(10⁸) + 2(2.5 × 10⁹) + 1(10¹⁰) = 1.53 × 10¹⁰
- Mw = 1.53 × 10¹⁰ / 230,000 = 66,522 g/mol
- Đ = 66,522 / 38,333 = 1.74
The single big chain (one-sixth of the molecules) accounts for 100,000/230,000 = 43 percent of the mass, so Mw is pulled toward it, while Mn is not.
Why the averages measure different things
Which average you get depends on the experiment, because different measurements respond to different things:
| Method | Average | Why |
|---|---|---|
| End-group analysis, osmometry | Mn | counts the number of molecules |
| Light scattering | Mw | scattering grows with mass squared |
| Viscometry | Mv | depends on coil size (Mark-Houwink law) |
| Gel permeation chromatography (GPC) | Mn, Mw, Mz and the whole curve | separates by size |
Chapter 5 treats these methods. For now remember the logic: count-based methods give Mn, mass-based methods give Mw. A few very small chains lower Mn strongly while hardly changing Mw; a few very large chains do the opposite.
Why it matters for properties
Molar mass sets the performance of a polymer, and the distribution matters too.
- Strength and toughness rise with molar mass and then level off. A polymer needs chains long enough to entangle and to span crystals; below a threshold (hundreds of repeat units) it is a brittle wax. Polyethylene with Mn of 2,000 g/mol is a wax; at 100,000 it is a tough film; at several million (ultra-high-molecular-weight PE) it makes fibers stronger than steel by weight.
- Melt viscosity climbs rapidly. Above a critical molar mass where chains entangle, the zero-shear viscosity scales roughly as
η₀ ∝ Mw^3.4. Doubling Mw multiplies the viscosity by about 10, which makes processing difficult. A broad distribution helps flow (short chains lubricate) while long chains supply strength, which is why industrial grades are not necessarily narrow. - Small chains can bleed out, soften or reduce strength; very long chains raise melt strength for blowing films.
- Recycling usually shortens chains by scission, so a recycled polymer shows a lower Mw and a changed distribution (chapter 8).
Typical distribution shapes
Two ideal distributions are worth remembering. For step-growth at high conversion, the most probable (Flory) distribution gives Đ = 1 + p, which approaches 2 as conversion p approaches 1. For an ideal living polymerization with fast initiation, the chain lengths follow a Poisson distribution with Đ ≈ 1 + 1/Xn. For a chain of 100 units that is about 1.01. Real samples lie between these ideals and have shapes that are often skewed toward high mass.
Reading a distribution like an expert
When experts look at a molar mass distribution curve, they ask a few quick questions. Where is the peak, and where do Mn and Mw sit relative to it? In a skewed distribution Mn, Mw and Mz appear in that order from left to right, and the peak of a weight-fraction curve usually sits to the left of Mw. How wide is it? A broad curve with Đ above 3 suggests multiple active sites, chain branching or a blend. Is there a shoulder or a second peak? A high-mass shoulder can mean branching or a few coupled chains; a low-mass tail can mean chain transfer, unreacted oligomers or early termination. Is the curve symmetric? A near-symmetric narrow peak is typical of a living polymerization.
You can also work backward. Suppose a GPC trace reports Mn = 45,000 g/mol and Mw = 90,000 g/mol. Then Đ = 2.0, and the shape is probably the most probable distribution from a step-growth reaction or from radical polymerization that ends mainly by disproportionation. If you see Mn = 30,000 and Mw = 33,000, then Đ = 1.1, and you can conclude that the sample was made by a controlled method. Reading Đ is a fast diagnostic of how a sample was made.
One practical caution concerns what goes into the numbers. GPC separates by size in solution, not by mass, so it reports masses relative to the standards used for calibration, often polystyrene. A branched chain is more compact than a linear one of equal mass, so it can look smaller than it really is. Absolute methods such as light scattering avoid this problem. Chapter 5 explains the details; for now, remember that every molar mass in a data sheet is a number with a method behind it.
Common misconceptions
"Mn and Mw are the same thing measured two ways." They are different averages of the same distribution. They are equal only for chains of identical mass.
"A lower Đ is always better." Narrow distributions are valuable for research and block copolymers, but for processing a modest breadth often improves flow and strength.
"Molar mass is a single property of the polymer." Molar mass belongs to a sample. Two samples of the same polymer can differ by a factor of a thousand.
Try it
The first program computes the averages for the worked example (so you can check the hand calculation) and any list you type. The second is an interactive lognormal distribution: move the sliders to see how the median and width change Mn, Mw and Đ. The third compares the broad Flory distribution with the narrow Poisson distribution at the same Mn.
Press Run (or Ctrl + Enter) to see the result here.
Program input · what you'd type while the program runs
Type the answers before you press Run, one per line. Each time the program reads a line (with input()), it gets the next line from this box.
Press Run (or Ctrl + Enter) to see the result here.
Program input · what you'd type while the program runs
Type the answers before you press Run, one per line. Each time the program reads a line (with input()), it gets the next line from this box.
Check your understanding
Quick check · 5 questions
of 5 answered You scored / 5 · perfect!
-
1. Which average is most affected by a few very large chains?
Mz weights chains by mass cubed over mass squared, so the heaviest chains dominate even more than in Mw. -
2. A sample contains only chains of identical mass. What is its dispersity?
If all chains are identical, Mw = Mn and Đ = 1. -
3. Which technique mainly reports Mn?
Osmometry counts the molecules, so it reports the number-average molar mass. -
4. Doubling Mw above the entanglement threshold changes zero-shear melt viscosity by about
With η₀ ∝ Mw^3.4, doubling gives 2^3.4 ≈ 10. -
5. Which pair of values for ideal distributions is correct?
The Flory distribution gives Đ = 1 + p, and a living polymerization with fast initiation gives a Poisson distribution with Đ ≈ 1 + 1/Xn.
Summary
- A polymer sample is a distribution of chain lengths, described by Mn (count-weighted), Mw (mass-weighted) and Mz, with Mn ≤ Mv ≤ Mw ≤ Mz.
- Dispersity Đ = Mw/Mn; about 2 for step-growth, 1.5 to 3 for typical radical products and 1.05 to 1.3 for well-controlled living processes.
- Molar mass controls strength, melt viscosity (η₀ ∝ Mw^3.4 above entanglement) and how recycling changes a polymer.
- Different measurements report different averages: osmometry gives Mn, light scattering gives Mw, and GPC gives the whole curve.
Track your progress
Create a free account to tick off lessons and pick up where you left off on any device.
of Polymer and Materials Chemistry lessons completed