


















Lesson 23 of 47 · Characterization
Molar Mass and GPC
Learn why polymers have molar-mass distributions, how to calculate Mn, Mw, Mz and dispersity, and how gel permeation chromatography measures them.
A bottle of water contains molecules that all weigh 18 g/mol. A bottle of polyethylene pellets contains chains that weigh anywhere from a few thousand to a few million grams per mole. There is no single "molar mass of the polymer", only a distribution, and the way you average that distribution changes the number you report.
This lesson shows how to define the averages, why they differ, and how gel permeation chromatography (GPC) measures the whole distribution in under an hour. You will also compute every average yourself from a small data table, which is the best way to make the formulas stick.
What you will learn
- Define Mn, Mw, Mz and dispersity (Đ) and say what each one weights.
- Calculate the averages from a table of chain counts and masses.
- Explain how a GPC column separates chains and why calibration matters.
- Interpret a dispersity value for step-growth, living and free-radical polymers.
Key terms
Number-average molar mass (Mn): total mass divided by the number of chains. Every chain counts equally.
Weight-average molar mass (Mw): an average weighted by mass, so heavy chains count more. Always at least as large as Mn.
Dispersity (Đ): the ratio Mw / Mn, a measure of how broad the distribution is. Đ = 1 only if all chains are identical.
Degree of polymerization (Xn): the average number of repeat units per chain, Mn divided by the repeat-unit mass.
Hydrodynamic volume: the volume a chain coil occupies in solution, which is what GPC really sorts by.
Defining the averages
Imagine a sample in which Nᵢ chains each have molar mass Mᵢ. The three averages you will meet most often are:
Mn = Σ Nᵢ Mᵢ   / Σ Nᵢ        (number average)
Mw = Σ Nᵢ Mᵢ²  / Σ Nᵢ Mᵢ     (weight average)
Mz = Σ Nᵢ Mᵢ³  / Σ Nᵢ Mᵢ²    (z average)
Đ  = Mw / Mn
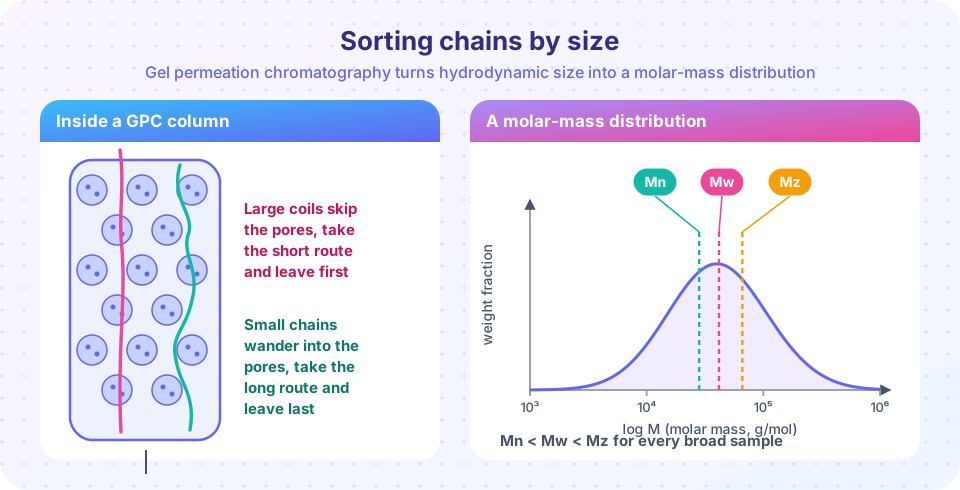
Notice the pattern: each average is the ratio of two consecutive moments of the distribution. Mn treats all chains equally; Mw weights each chain by its mass; Mz weights by mass squared. Because heavier chains get more weight as you move along the series, Mn ≤ Mw ≤ Mz always, with equality only when the sample is perfectly uniform.
Why do we care about several averages? Because different properties respond to different parts of the distribution. Colligative properties such as osmotic pressure and end-group analysis count molecules, so they give Mn. Light scattering is dominated by big particles, so it gives Mw. Melt elasticity and some toughness measures are sensitive to the longest chains, which Mz emphasizes. A viscosity measurement gives a viscosity-average Mv, which lies between Mn and Mw, usually close to Mw.
A worked example
A sample contains 100 chains of 10,000 g/mol, 100 chains of 30,000 g/mol and 50 chains of 100,000 g/mol.
ΣNM   = 100×10,000 + 100×30,000 + 50×100,000 = 9,000,000
ΣN    = 250
Mn    = 9,000,000 / 250 = 36,000 g/mol

ΣNM²  = 100×1e8 + 100×9e8 + 50×1e10 = 6.0e11
Mw    = 6.0e11 / 9.0e6 = 66,667 g/mol
Đ     = 66,667 / 36,000 = 1.85
Only 20 % of the chains are the long ones, yet they push Mw far above Mn. That gap is exactly what dispersity measures.
How GPC works
In GPC (also called size-exclusion chromatography, SEC) a dilute polymer solution is pumped through a column packed with porous beads, usually cross-linked polystyrene for organic solvents or a polar gel for water. The beads contain pores of a range of diameters.
- A large coil cannot fit into most pores. It travels mainly between the beads, a short path, and leaves the column first.
- A small coil can wander into many pores. It takes a longer path and leaves later.
So chains elute in order of decreasing size, not by chemical interaction. A detector at the outlet records the amount of polymer at every moment. The standard detector is a differential refractive index (RI) detector, whose signal is proportional to concentration. The result is a chromatogram: signal against retention time, which maps to log of molar mass after calibration.
Calibration is everything
Retention time depends on hydrodynamic volume, not on mass. To convert time to molar mass, you run narrow standards of known mass (commonly polystyrene) and draw a calibration curve of log M against elution time. This gives relative molar masses: a polyester that elutes at the same time as a polystyrene of 50,000 g/mol is reported as "50,000 polystyrene equivalent", even though its true mass may differ, because polyester coils are a different size at the same mass.
There are three ways around this limit:
- Universal calibration, using the Mark–Houwink relation
[η] = K Mᵃand the fact that[η]·Mis proportional to hydrodynamic volume. - Multi-angle light scattering (MALS), an extra detector that measures
Mwof each slice directly without calibration. - A viscometer detector, which gives intrinsic viscosity of each slice.
In practice most routine reports state "relative to polystyrene standards" in the footnote, and you should read that footnote before comparing two numbers.
When a paper reports GPC results, look for four conditions: the eluent (THF, DMF, chloroform, water), the temperature, the calibration standard and the detector. Without them the numbers cannot be compared with yours.
Interpreting dispersity
Typical values of Đ reflect the way chains grow:
| Polymerization | Typical Đ | Why |
|---|---|---|
| Ideal living / controlled (anionic, RAFT, ATRP) | 1.02 - 1.3 | All chains start together and grow at the same rate |
| Step-growth at high conversion | about 2.0 | Random coupling gives the Flory most-probable distribution |
| Free radical, termination by disproportionation | about 2.0 | Random termination |
| Free radical with branching or chain transfer | 2 - 10 or more | Many growth histories |
| Ziegler-Natta polyolefins | 3 - 10 | Several active-site types |
Narrow samples (Đ close to 1) are used as standards and for research on block copolymers. Broad samples are not "worse": industrial polyethylene is often deliberately broad because short chains help processing while long chains provide strength.
For a Poisson-like living polymerization the relation Đ ≈ 1 + 1/Xn holds, so longer chains give narrower relative distributions. A chain of 100 units has Đ close to 1.01 under ideal conditions; real systems are broader due to slow initiation and side reactions.
Common misconceptions
"Mn and Mw are two measurements of the same thing." They are two different averages of the same distribution. They are equal only for a perfectly uniform sample.
"GPC gives the true molar mass." Without light scattering or universal calibration, GPC gives mass relative to the standard. A different polymer can give a number that is wrong by tens of percent.
"Lower dispersity always means a better polymer." It means a narrower, more uniform polymer, which is valuable for research and self-assembly but not required (or even desirable) for many commodity applications.
Try it
First, compute all the averages from a table. Change the numbers and watch how the tail of long chains moves Mw and Mz while Mn barely moves.
Press Run (or Ctrl + Enter) to see the result here.
Program input · what you'd type while the program runs
Type the answers before you press Run, one per line. Each time the program reads a line (with input()), it gets the next line from this box.
Second, draw a realistic distribution and mark the three averages. This uses a log-normal shape, a common model for a GPC trace. It is a model, not measured data.
Press Run (or Ctrl + Enter) to see the result here.
Program input · what you'd type while the program runs
Type the answers before you press Run, one per line. Each time the program reads a line (with input()), it gets the next line from this box.
Check your understanding
Quick check · 5 questions
of 5 answered You scored / 5 · perfect!
-
1. In GPC, which chains leave the column first?
Large coils are excluded from the pores and take the short path between beads, so they elute early. -
2. A sample has Mn = 40,000 g/mol and Mw = 60,000 g/mol. What is its dispersity?
Đ = Mw / Mn = 60,000 / 40,000 = 1.5. -
3. Which statement about the averages is always true for a broad sample?
Each successive average weights heavier chains more, so the sequence rises: Mn < Mw < Mz. -
4. Why is GPC with polystyrene standards only a relative method?
Two polymers of equal mass can have coils of different size, so calibrating with polystyrene gives polystyrene-equivalent masses. -
5. Which polymerization typically gives the narrowest distribution?
In living systems all chains start together and grow at similar rates, giving Đ often below 1.3.
Summary
- Polymers have a distribution of chain lengths, so we report averages:
Mn,Mw,Mzand the dispersityĐ = Mw / Mn. - Heavier chains weigh more as you go from
MntoMz, soMn ≤ Mw ≤ Mz. - GPC separates chains by hydrodynamic volume: large coils exit first. A calibration curve or a light-scattering detector converts time to molar mass.
- Dispersity depends on mechanism: about 1.1 for living polymerization, about 2 for step growth or disproportionation, and larger for branched or multi-site systems.
Track your progress
Create a free account to tick off lessons and pick up where you left off on any device.
of Polymer and Materials Chemistry lessons completed