


















Lesson 25 of 47 · Characterization
Spectroscopy, Diffraction and Microscopy
Identify polymers with FTIR and NMR, measure crystal spacings with Bragg's law, and match SEM, TEM and AFM to the length scale you need to see.
Size and thermal data tell you how a polymer behaves, but not what it is made of or how it looks inside. For that you need light and beams: infrared light that makes bonds vibrate, radio waves that make nuclei flip, X-rays that bounce off crystal planes and electrons or tiny tips that draw a picture of the surface.
Each technique answers a different part of the question "what is this stuff?" By the end of this lesson you will be able to read an infrared spectrum for key groups, compute a crystal spacing with Bragg's law and choose between optical, electron and atomic-force microscopy for a given feature size.
What you will learn
- Explain why bonds absorb infrared light and read the main bands of common polymers.
- Use NMR integrals to find copolymer composition.
- Apply Bragg's law and the Scherrer equation to X-ray diffraction data.
- Choose the right microscopy method for a feature size from micrometers to nanometers.
Key terms
Wavenumber (ṽ): the number of waves per centimeter, in cm⁻¹. It is the standard x-axis of an IR spectrum and is proportional to energy.
Chemical shift (δ): the position of an NMR signal in ppm, which depends on the electronic environment of the nucleus.
Bragg's law: n λ = 2 d sin θ, linking X-ray wavelength, plane spacing and diffraction angle.
Crystallite: a small, ordered region in a polymer; many crystallites plus amorphous chains make up a semi-crystalline solid.
Spherulite: a spherical crystalline superstructure, micrometers to millimeters across, built from radiating lamellae.
Infrared spectroscopy (FTIR)
Chemical bonds behave a little like springs. A spring with force constant k joining masses with reduced mass μ vibrates at a frequency set by √(k/μ). Stiffer bonds (double and triple) and lighter atoms vibrate faster. If the vibration changes the dipole moment of the bond, it can absorb infrared light of exactly that frequency, and the spectrometer records the absorbance at each wavenumber.
In a modern instrument an interferometer measures all frequencies at once and a Fourier transform converts the signal into a spectrum, which is where the name FTIR (Fourier-transform infrared) comes from. The common sampling method for plastics is ATR (attenuated total reflection): you press the sample against a crystal and no preparation is needed.
Useful bands for polymer work:
| Wavenumber (cm⁻¹) | Assignment | Seen in |
|---|---|---|
| 3300 - 3500 (broad) | O–H or N–H stretch | Alcohols, polyamides, polyurethanes, wet samples |
| 2850 - 3000 | C–H stretch | Nearly every organic polymer |
| about 1730 | C=O stretch of ester | PMMA, PET, PLA, polyurethane |
| about 1640 - 1680 | C=O of amide (amide I) | Nylons, proteins |
| 1600, 1500 | aromatic C=C | Polystyrene, PET |
| 1000 - 1300 | C–O, C–F stretches | Esters, ethers, PTFE (very strong C–F) |
| about 720 | CH₂ rocking in long chains | Polyethylene |
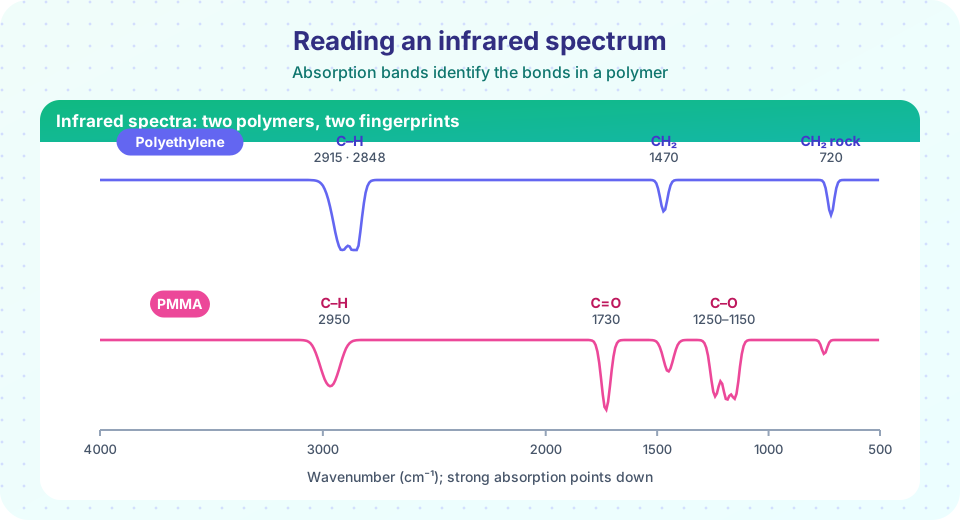
The region below about 1500 cm⁻¹ is called the fingerprint region: it is complex but unique to each compound, so a spectrum can be matched against a library. The picture above shows why FTIR is such a fast screen: polyethylene has almost nothing but C–H bands, while PMMA announces itself with a strong carbonyl peak.
FTIR does more than naming plastics. A growing carbonyl band at 1710 to 1740 cm⁻¹ in polyethylene tracks oxidation (weathering); a disappearing band at 1630 cm⁻¹ tracks the consumption of C=C bonds during curing; the O–H band tracks moisture.
NMR spectroscopy
In a strong magnetic field, nuclei such as ¹H and ¹³C absorb radio waves at frequencies that depend on their surroundings. The pattern tells you which kinds of hydrogen or carbon are present, and integrals (the area under each signal) are proportional to the number of nuclei, so they give ratios.
Copolymer composition. In poly(styrene-co-methyl methacrylate), styrene contributes five aromatic protons (about 6.3 to 7.2 ppm) per unit and MMA contributes three protons in its O–CH₃ group (about 3.6 ppm). If the integrals are 10.0 for the aromatic region and 9.0 for the methoxy signal:
moles styrene = 10.0 / 5 = 2.0
moles MMA     =  9.0 / 3 = 3.0
mole fraction styrene = 2.0 / 5.0 = 0.40
NMR also gives tacticity (the sequence of stereochemistry along the chain, from fine splitting of backbone signals), end groups (which gives Mn of short chains by comparing end-group integrals with repeat-unit integrals) and branching. Its limits: samples usually need to dissolve, and cross-linked networks need solid-state NMR.
X-ray diffraction (XRD)
Crystals diffract X-rays because their atoms lie in repeating planes. Waves reflected from adjacent planes reinforce when the extra path length is a whole number of wavelengths:
n λ = 2 d sin θ (Bragg's law)
Here d is the spacing between planes and θ is the angle between the beam and the planes; instruments record the angle 2θ. With copper Kα radiation, λ = 0.15406 nm.
Polyethylene shows strong peaks at 2θ ≈ 21.5° and 23.9°, from the (110) and (200) planes of its orthorhombic crystal. Applying Bragg's law (n = 1):
d(110) = 0.15406 / (2 × sin 10.75°) = 0.413 nm
d(200) = 0.15406 / (2 × sin 11.95°) = 0.372 nm
Amorphous regions give a broad halo instead of sharp peaks, so the ratio of peak area to total area estimates crystallinity independently of DSC. Peak width gives crystallite size by the Scherrer equation:
L = K λ / (β cos θ) (K ≈ 0.9; β = peak width in radians)
Broader peaks mean smaller crystals. SAXS (small-angle X-ray scattering) looks at larger spacings, 1 to 100 nm, such as the stacking of lamellae or the domains of block copolymers.
Microscopy: matching the tool to the scale
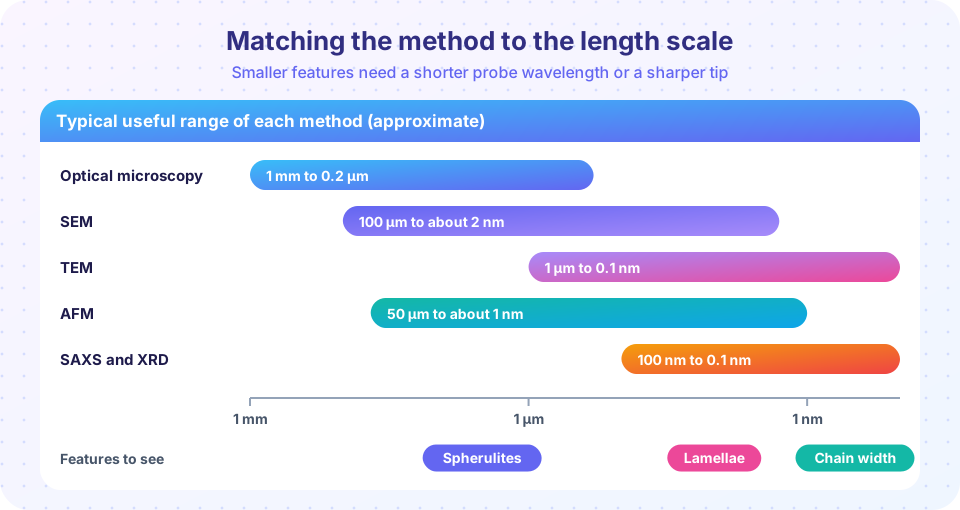
- Optical microscopy, especially between crossed polarizers, shows spherulites as bright discs with a dark "Maltese cross", because crystals rotate polarized light and amorphous regions do not. Resolution is limited to about 0.2 µm by the wavelength of light.
- SEM (scanning electron microscopy) rasters a focused electron beam over the surface and builds an image from emitted electrons. Plastics are insulators, so they are usually coated with a few nanometers of gold or carbon to prevent charging. SEM is the standard way to inspect fracture surfaces, fibers, filler dispersion and foam cells.
- TEM (transmission electron microscopy) sends electrons through a slice thinner than about 100 nm. It resolves features down to fractions of a nanometer, but polymers have low contrast, so slices are often stained (with ruthenium or osmium tetroxide, for example) to darken one phase of a block copolymer or rubber blend.
- AFM (atomic force microscopy) drags or taps a sharp tip across the surface and records its height. It needs no vacuum or coating, works on soft materials, and the phase image distinguishes hard and soft regions.
Common misconceptions
"A library match is proof of identity." A match says the spectrum resembles the library entry. Additives, fillers, surface coatings and blends can all distort a spectrum, and ATR samples only the top micrometer or so.
"XRD shows a polymer is either crystalline or not." Most polymers are semi-crystalline: sharp peaks on top of an amorphous halo. The question is how much, not whether.
"Electron microscopes show what a sample looks like in real life." Coatings, vacuum, stains and beam damage change polymers. Always ask what the preparation might have altered.
Try it
First, a calculator that links a measured diffraction angle to a plane spacing and applies Scherrer's equation. Change the peak width and watch the crystallite size change.
Press Run (or Ctrl + Enter) to see the result here.
Program input · what you'd type while the program runs
Type the answers before you press Run, one per line. Each time the program reads a line (with input()), it gets the next line from this box.
Second, a Hooke's-law model of bond vibrations. With approximate force constants it reproduces the ordering of the IR bands you saw above, which is the physical reason an IR spectrum is a bond fingerprint.
Press Run (or Ctrl + Enter) to see the result here.
Program input · what you'd type while the program runs
Type the answers before you press Run, one per line. Each time the program reads a line (with input()), it gets the next line from this box.
Third, a copolymer composition from NMR integrals. Change the integrals and the numbers of protons per signal to practice with other monomer pairs.
Press Run (or Ctrl + Enter) to see the result here.
Program input · what you'd type while the program runs
Type the answers before you press Run, one per line. Each time the program reads a line (with input()), it gets the next line from this box.
Check your understanding
Quick check · 5 questions
of 5 answered You scored / 5 · perfect!
-
1. A spectrum shows a strong sharp band at 1730 cm⁻¹. Which group is most likely present?
An ester C=O stretch appears near 1730 cm⁻¹, which is why PMMA, PET and PLA all show it. -
2. In NMR, why can integrals give copolymer composition?
After dividing each integral by the number of protons it represents, you obtain relative moles of each monomer. -
3. A diffraction peak appears at 2θ = 21.5° with Cu Kα (0.15406 nm). The plane spacing is closest to:
d = λ / (2 sin θ) = 0.15406 / (2 × sin 10.75°) is about 0.413 nm. -
4. Which method best images a feature about 5 nm wide in a stained block-copolymer film?
TEM resolves nanometer features, and staining gives the contrast between the two blocks. -
5. A broad XRD peak compared with a narrow one indicates:
By the Scherrer equation, crystallite size is inversely proportional to peak width.
Summary
- FTIR identifies groups through bond vibrations: C=O near 1730 cm⁻¹, C–H near 2900 cm⁻¹, O–H or N–H above 3200 cm⁻¹.
- NMR integrals give composition; fine splitting gives tacticity; end groups give Mn of short chains.
- Bragg's law (
n λ = 2 d sin θ) converts diffraction angles to plane spacings; peak width gives crystallite size; the amorphous halo gives crystallinity. - Optical, SEM, TEM and AFM cover different length scales; sample preparation (coating, staining) can change what you see.
Track your progress
Create a free account to tick off lessons and pick up where you left off on any device.
of Polymer and Materials Chemistry lessons completed