


















Lesson 19 of 47 · Structure and Properties
Mechanical properties: stress, strain, strength and toughness
Read stress-strain curves for brittle plastics, ductile plastics and rubbers, define modulus, yield and toughness, and see why rubber elasticity is an entropy effect.
A coat hanger snaps, a milk jug stretches, a rubber band returns to its length. All three are polymers under tension, and all three can be described by one simple test: pull a standard sample at a constant speed and record how much force it takes to stretch it a given amount. The resulting stress-strain curve is a fingerprint of a material. Its slope, peaks and end point tell you how stiff, how strong and how tough the material is, and they link directly to the structures of the previous lesson: glassy or rubbery, crystalline or crosslinked. This lesson teaches you to read that fingerprint and shows where the numbers come from.
What you will learn
- The definitions of stress, strain, Young's modulus, yield strength, tensile strength and toughness
- How to recognize brittle, ductile and elastomeric behavior in a stress-strain curve
- Why a necked plastic can be drawn into strong fibers
- Why the stress in a rubber is an entropic effect that rises with temperature
- How temperature and loading speed change the picture
Key terms
Stress (σ): force per unit original cross-section area, σ = F/A₀, in pascals (Pa) or megapascals (MPa).
Strain (ε): change in length divided by original length, ε = ΔL/L₀, dimensionless (often quoted as a percent).
Young's modulus (E): the slope of the initial linear part of the curve, E = σ/ε; a measure of stiffness.
Yield point: the stress at which deformation stops being fully recoverable.
Toughness: the energy absorbed per unit volume before fracture; the area under the curve.
From force to curve
In a tensile test, a dumbbell-shaped specimen is clamped at both ends and stretched. The machine records force F and elongation ΔL. Dividing by the original cross-section A₀ and original length L₀ gives engineering stress and strain. Because the area changes during deformation, the true stress is higher after necking, but engineering curves are the standard way of reporting.
Several moduli describe different ways of loading. Young's modulus E is for tension, shear modulus G for shearing and bulk modulus K for compression. For isotropic materials, E = 2G(1 + ν), where ν is Poisson's ratio, the sideways contraction accompanying stretch. Glassy plastics have ν near 0.35 to 0.4 and rubbers have ν close to 0.5, meaning their volume stays nearly constant, so for rubbers E ≈ 3G.
Reading the curve
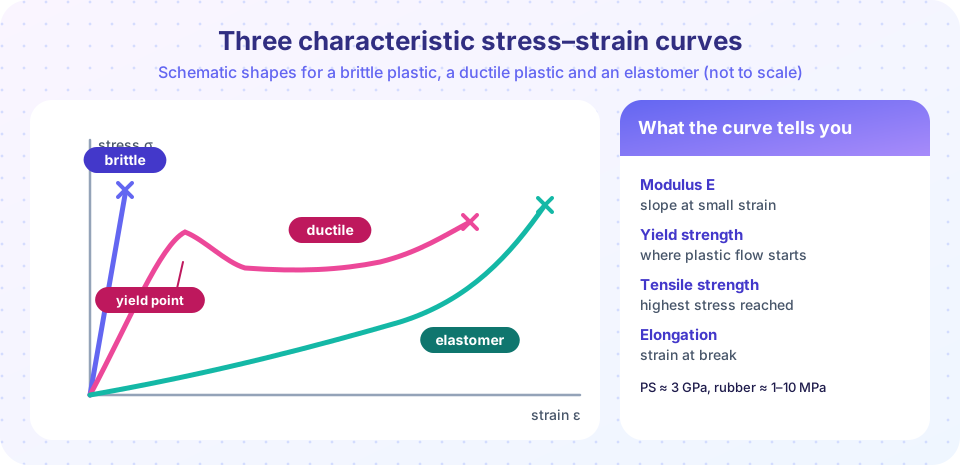
The linear region. At small strain the response is elastic: the curve is a straight line with slope E, and the sample returns to its original length when unloaded. In glassy polymers this reflects stretching of bonds and bending of bond angles; weak intermolecular forces limit stiffness to a few GPa, far below that of steel (about 200 GPa), because forces between chains, not covalent bonds, are being stretched.
Yield. At higher stress, chains start to slip and rearrange. The curve bends over and often passes through a maximum, the yield point. Beyond it, deformation is largely permanent. For polymers without a sharp peak, yield is defined by a standard offset (for example the stress where the curve is 0.2 percent above the elastic line).
Necking and cold drawing. In many semicrystalline polymers, deformation concentrates in one narrow region, a neck. Instead of failing, the neck spreads along the specimen at nearly constant stress, a process called cold drawing. As the material is drawn, chains align along the direction of pull and crystals reorient, so the drawn material is stronger and stiffer along that direction. This is how fibers and films are made: nylon and polyester fibers, polypropylene tapes and the biaxially oriented film in snack packaging are drawn well above their yield and often above Tg.
Strain hardening and fracture. After the neck has consumed the specimen, aligned chains resist further stretching and the stress rises until the specimen breaks. The strain at break is the elongation at break; the stress at the maximum is the tensile strength.
Four families of behavior
- Hard and brittle: polystyrene, PMMA, unmodified epoxy. High modulus (2 to 4 GPa), fracture at 1 to 5 percent strain with no yielding. Cracks form in tiny voids called crazes, which join into fracture.
- Hard and tough (ductile): nylons, PET, polycarbonate. High modulus, clear yield, long drawing and high energy absorption. Polycarbonate is used for bullet-resistant glazing and helmet visors because it yields rather than shatters.
- Soft and tough: polyethylene and polypropylene. Lower modulus (about 1 GPa), yield at 20 to 35 MPa, then cold draw to several hundred percent strain.
- Elastomers: rubbers and thermoplastic elastomers. Modulus of 1 to 10 MPa, huge reversible strain (several hundred percent), and nearly complete recovery.
| Polymer | Modulus E (GPa) | Strength or yield (MPa) | Elongation at break |
|---|---|---|---|
| Polystyrene | about 3 | 40 to 55 | 1 to 3 % |
| PMMA | about 3 | 50 to 75 | 2 to 5 % |
| Polycarbonate | about 2.3 | about 60 | over 100 % |
| Nylon 6,6 (dry) | about 3 | about 80 | 15 to 60 % |
| HDPE | about 1 | 20 to 30 | over 100 % |
| Polypropylene | about 1.5 | 30 to 38 | 100 to 600 % |
| Natural rubber (vulcanized) | about 0.002 | 20 to 30 at break | 500 to 800 % |
These ranges are typical for common grades and vary with molar mass, processing, temperature and moisture.
Strength is not toughness
Strength says what stress the material can bear; toughness says how much energy it absorbs. A ceramic plate may be stiff and strong yet shatter, whereas a polyethylene sheet is weaker but absorbs much more energy because it deforms before breaking. Toughness equals the area under the stress-strain curve, in MJ/m³ when stress is in MPa. Real impact behavior also depends on notches and on speed: Izod and Charpy tests strike a notched bar with a pendulum and measure energy absorbed.
Brittle plastics can be toughened. High-impact polystyrene (HIPS) contains rubber particles that start many small crazes instead of one large crack, absorbing energy. ABS and impact-modified nylon use the same idea.
Temperature and speed
Because polymer chains need time and thermal energy to rearrange, mechanical properties depend on both. As temperature rises through Tg, E drops by a factor of up to 1000 for an amorphous polymer. Cooling, or pulling faster, gives a stiffer, stronger and more brittle response; warming or pulling slowly gives a softer and more ductile one. A polymer that is tough at room temperature can crack in a freezer: the ductile–brittle transition is often near or below Tg for the amorphous phase. Viscoelasticity, the topic of the next lesson, puts numbers on this.
Rubber elasticity: an entropy spring
A steel spring stores energy in stretched bonds. A rubber stores almost no energy that way. Take a network of flexible chains: in the relaxed state each chain is a random coil with many available conformations, so entropy is high. Stretching pulls the chains into fewer, more aligned conformations: entropy falls. Since F = −T(∂S/∂L) for an ideal rubber, the restoring force comes from entropy and is proportional to temperature. The standard result for uniaxial stretch by a factor λ = L/L₀ is
σ = G (λ − 1/λ²), with G = νRT = ρRT/Mc
where ν is the number of network chains per volume (moles per m³), ρ the density and Mc the molar mass between crosslinks. A rubber with ρ = 920 kg/m³ and Mc = 5,000 g/mol has ν = 184 mol/m³ and, at 298 K, G ≈ 0.46 MPa and E ≈ 3G ≈ 1.4 MPa.
Two consequences are surprising. A stretched rubber band gets stiffer when heated; a weight hung on a rubber band lifts as the band is warmed, an effect studied by Gough in 1805 and Joule in 1859 (a metal wire does the opposite). And a rubber band stretched rapidly and pressed to the lip feels warm, since stretching aligns chains and releases heat.
Oriented polymers: the strongest fibers
Pulled to align chains, polymers are very strong in the pull direction because the covalent backbone, not the weak intermolecular forces, carries the load. Aramid fibers (Kevlar) and gel-spun ultra-high-molecular-weight polyethylene reach tensile strengths of the order of 3 GPa, comparable to high-grade steel wire, but with densities near 1 to 1.4 g/cm³, so their specific strength is far higher. A perfect polyethylene crystal would have a theoretical modulus of about 250 GPa along the chain; real fibers achieve a fraction of that.
Common misconceptions
"Polymers are weak because their bonds are weak." The backbone bonds are as strong as in any organic compound. In an unoriented plastic the load goes through weak forces between chains; in an oriented fiber, the backbone carries it.
"Stronger means tougher." A strong brittle plastic can absorb little energy; a weaker ductile one may absorb a lot.
"A stretched rubber stores energy in stretched bonds." It stores mostly entropy: the chains are pulled out of their most probable coiled states.
Try it
The first program builds simple stress-strain curves for a brittle and a ductile plastic (models, not measured data), then extracts modulus, yield strength and toughness exactly as you would from a test. The second plots ideal rubber elasticity for different crosslink densities and shows how stress at fixed stretch varies with temperature.
Press Run (or Ctrl + Enter) to see the result here.
Program input · what you'd type while the program runs
Type the answers before you press Run, one per line. Each time the program reads a line (with input()), it gets the next line from this box.
Press Run (or Ctrl + Enter) to see the result here.
Program input · what you'd type while the program runs
Type the answers before you press Run, one per line. Each time the program reads a line (with input()), it gets the next line from this box.
Check your understanding
Quick check · 5 questions
of 5 answered You scored / 5 · perfect!
-
1. What does the area under a stress-strain curve represent?
Stress times strain has units of energy per volume, and the area up to fracture is the toughness. -
2. A 50 mm gauge length extends by 1 mm in the elastic region under a stress of 30 MPa. What is E?
ε = 1/50 = 0.02, so E = 30 MPa / 0.02 = 1,500 MPa = 1.5 GPa. -
3. What happens during cold drawing of a semicrystalline polymer?
Deformation concentrates in a neck that propagates at nearly constant stress, orienting chains. -
4. Why does a stretched rubber band at constant length exert more force when warmed?
In an ideal rubber, σ = νRT(λ − 1/λ²), so stress rises with temperature. -
5. High-impact polystyrene is tougher than ordinary polystyrene because
Rubber domains initiate multiple crazes and shear bands, dissipating energy instead of letting one crack run.
Summary
- Stress-strain curves give modulus (slope), yield and tensile strength, elongation at break and toughness (area); behaviors range from brittle to ductile to elastomeric.
- Plastics yield and cold-draw by aligning chains; oriented fibers can reach strengths of several GPa because covalent bonds carry the load.
- Rubber elasticity is entropic:
σ = νRT(λ − 1/λ²); temperature and loading rate shift all behavior toward glassy or rubbery.
Track your progress
Create a free account to tick off lessons and pick up where you left off on any device.
of Polymer and Materials Chemistry lessons completed